
According to the IDC China Anti- DDoS Hardware Market Share, 2022: Opportunities and Challenges Coexist published on June 29, 2023, NSFOCUS, with its Anti-DDoS solution powered by a robust protection algorithm and excellent services, has again claimed the leading position in China's Anti-DDoS hardware market. NSFOCUS keeps ahead of this...
Tag: DDoS attack

Enhancing Campus Network Resilience: How NSFOCUS Anti-DDoS Solution Safeguards the Education Sector from DDoS Attacks
Customer Overview The customer is a leading research-intensive university in Asia, with a distinguished history and a reputation for excellence in teaching and research. The university has a large campus network that serves students, faculty, staff, external partners, and visitors. With the increasing threats of DDoS attacks, the customer recognized...
Importing an NTA Configuration File
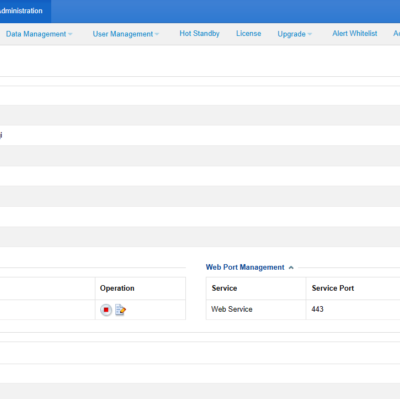
NTA allows users to import and export configuration files so as to meet users' requirements for quick configuration restoration and local configuration file backup. To import a configuration file, perform the following steps: Choose Administration > System Configuration > Basic Information > Import Config. Select a configuration file to be...
Global Threat Intelligence Function of NSFOCUS ADS
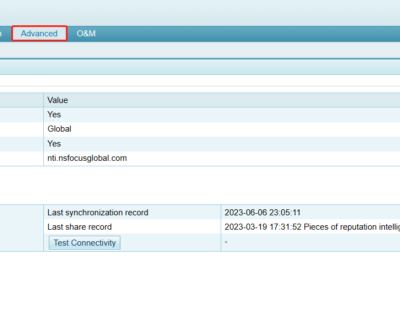
Powered by NSFOCUS Threat Intelligence (NTI), NSFOCUS ADS can block IP addresses that pose serious threats and high risks. To ensure data reliability, ADS updates intelligence data daily and provides available update time frames for users to select. For the purpose of preventing IP blocking by mistake, you can configure...

NSFOCUS Lua-based Anti-DDoS Solution
Limitations of Pre-configured DDoS Protection Policies Lots of organizations have realized that DDoS defense is critical to the availability of network infrastructure. But most Anti-DDoS solutions in the market still rely on pre-configured protection policies with multiple threshold options to offer multi-layered protection at different levels. However, this approach has...
Pay Attention to New SLP Vulnerability That May Lead to Massive DDoS Amplification Attacks
A new reflective Distributed-Denial-of-Service (DDoS) amplification vulnerability was recently discovered in the Service Location Protocol (SLP), which allows attackers to achieve a high amplification factor of over 2,200 times. This vulnerability has been identified as CVE-2023-29552, potentially making it one of the largest amplification attacks ever recorded. SLP is a...