Key Findings – 5
The Number of DDoS Attacks on Healthcare, Education, and Government Sectors Increased Significantly During the COVID-19 Pandemic
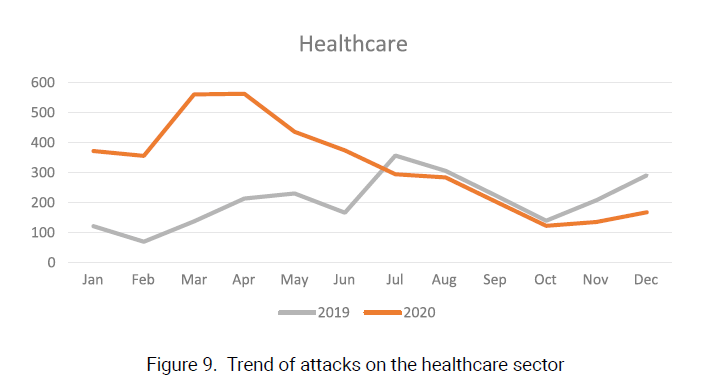
The healthcare sector suffered more DDoS attacks during the COVID-19 pandemic than previous years. According to statistics2, the number of attacks in each month in 2020 H2 increased year on year, with March and April seeing the most attacks. In subsequent months, DDoS attacks trended down. The attack trend after July of 2020 coincided with the same period of 2019, with the monthly number decreasing a bit year on year.
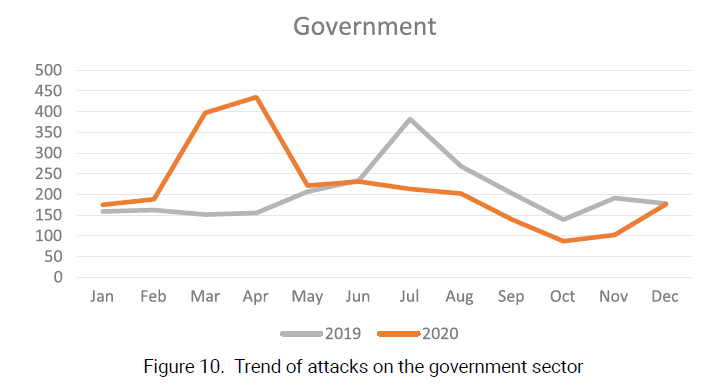
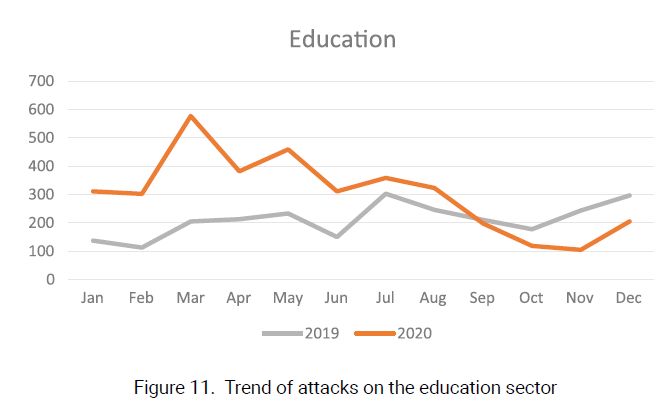
DDoS attacks on government and education sectors trended similarly. A slight difference is that for these two sectors, DDoS attacks in the latter half of the year declined more rapidly.
Key Findings – 6
The Total Traffic Volume Generated by One IP Chain-gang Hit 3624 TB, More Than Doubling the Figure of The Previous Year
A DDoS attack is usually conducted by multiple actors that work in a coordinated manner. Such actors are mostly repeat hackers found to be repeatedly linked with malicious activities. We call these groups “IP chain-gangs”. In this report, through analysis of DDoS attack data collected by NSFOCUS in 2020, we have identified multiple IP chain-gangs and done a systematic research on their behavior.
The logic behind this research methodology is that IP addresses with similar historical attack behavior form an IP chain-gang. The behavior similarity is reflected in the following aspects:
- Behavior similarity in a short time: hitting the same target again and again using the same attack method in the same period.
- Behavior similarity in the long run: hitting the same target repeatedly using the same attack method in different periods.
After analyzing behaviors of IP chain-gangs and profiling major gangs, we found that:
- Infrastructures such as IoT devices and Internet Data Centers comprised a large proportion of those IP chain-gangs being controlled over a long period.
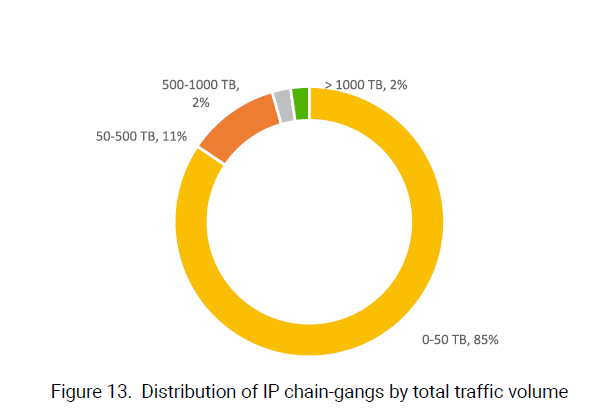
- The total traffic volume generated by one group hit 3624 TB, more than doubling the figure of the previous year.
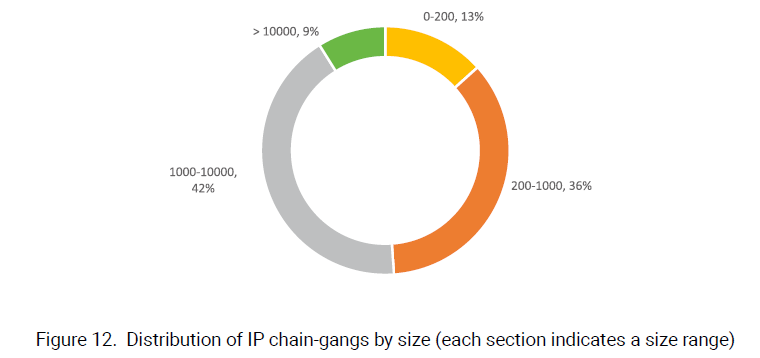
In 2020, a total of 45 active gangs were found, most of which had 200 to 10,000 members, as shown in figure below. Besides, four gangs consisted of over 10,000 members and the largest one had 49,000 members.
The figure below shows the distribution of IP chain-gangs in terms of traffic generated by all members within a gang. The total traffic volume generated by one gang hit 3624 TB, more than doubling the figure of the previous year.
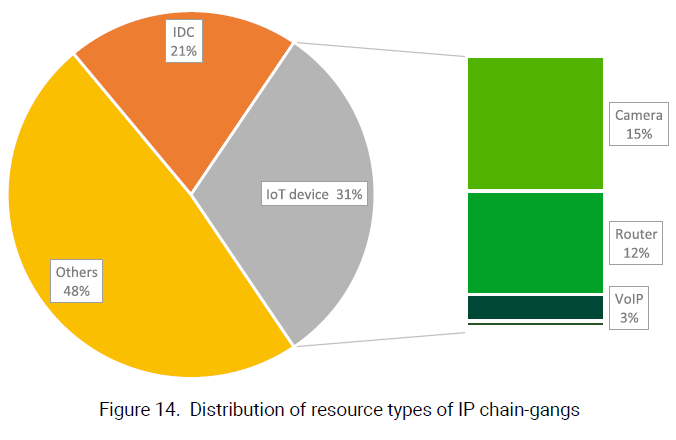
Attack resources that can be long manipulated are mainly IDCs and IoT devices. According to statistics around resource types, IoT devices were the most common type in IP chain-gangs, accounting for 31% of all controlled resources. Specifically, cameras made up the largest proportion (15%), followed by routers (12%) and VoIP (3%).