
In the 24-Hour Traffic graph under Logs -> Logs Analysis > Attack Traffic Statistics of ADS, you will find the graph displaying three lines: ALL_RX_MAX (represented by the red line), ALL_RX (represented by the green line), and ALL_TX (represented by the blue line).
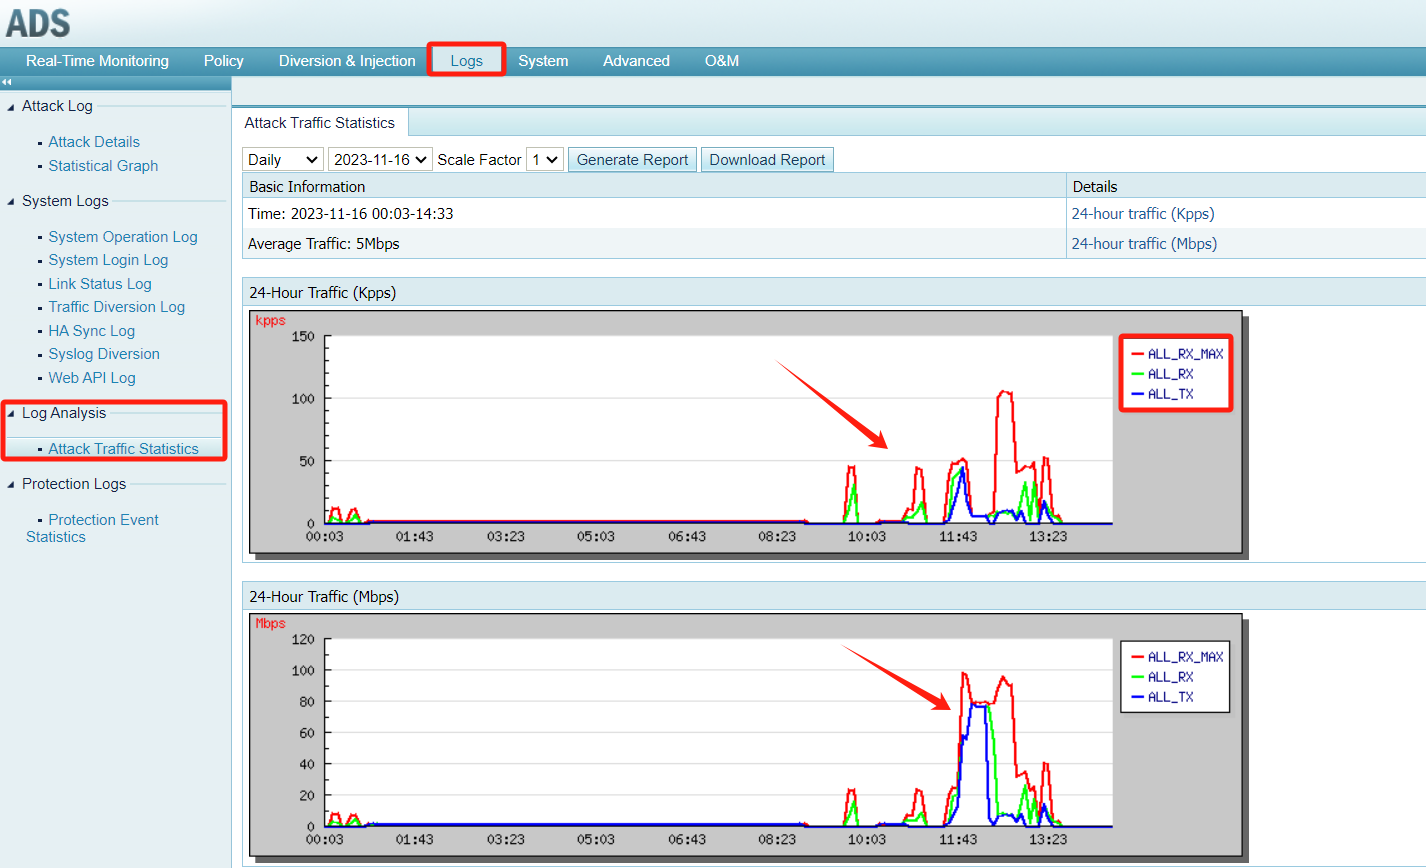
The explanation of each line is:
- ALL_TX (blue line): Average value of transmitted traffic every 5 minutes.
- ALL_RX (green line): Average value of traffic received every 5 minutes.
- ALL_RX_MAX (red line): Maximum value of traffic received every 5 minutes.
It’s important to note that the red line (ALL_RX_MAX), representing the maximum received traffic, may surpass the other two lines, which portray average values. This is a normal condition.