
3.4Â Behavioral Analysis of Attack Sources
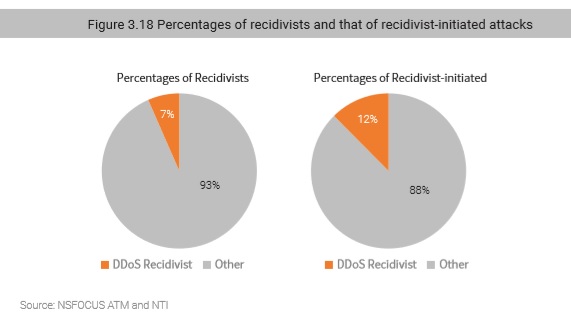
In the 2018 H1 Cybersecurity Insights8, we mentioned that the number of DDoS recidivists (repeat DDoS offenders) was too large to ignore. Of all internet attack types, 25% of attackers were recidivists responsible for 40% of all attack events. As for DDoS attacks, 7% of attackers were recidivists that launched 12% of attack events. (Here, “DDoS recidivists” refer to source IP addresses that have been marked by NSFOCUS Threat Intelligence center (NTI) as DDoS attack sources.) Clearly, in DDoS attacks, the proportion of recidivists decreased in 2018, indicating a lower level of resource reuse. This can be attributed to two factors:
(1) There are large quantities of attack resources publicly available via the Internet, and attackers can easily obtain such resources through repeated scanning, making it unnecessary to retain attack resources for a long time. Most recidivists are long-lasting harmful resources on the Internet that are very easy to leverage for attackers around the world.
(2) DDoS attacks are typically the last step to complete the kill chain. When hosts/devices are leveraged to conduct DDoS attacks, maintenance personnel can easily spot them and promptly fix the problem. Therefore, a large proportion of bot hosts previously used in a DDoS attack will be abandoned later, making it necessary for hackers to rescan and infect hosts to expand the botnet size.
Furthermore, we notice that, regardless of the attack type, the proportion of attacks initiated by recidivists is often twice that of number of recidivists themselves. Recidivists should be considered quite threatening, and their activities should be closely monitored.
3.4.1Â Anomalous Behavior
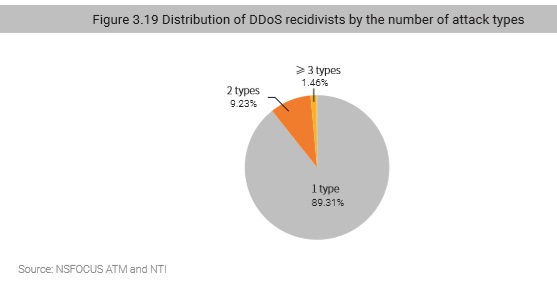
Attack resources used in DDoS attacks are typically involved in only one attack type. Among all DDoS sources, 89% have conducted only one type of anomalous activity and only a small proportion are found to have engaged in several (up to six) types of anomalous activity.
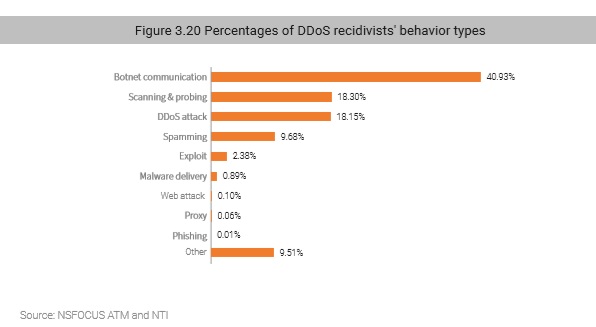
As shown in Figure 3.20, 41% of attack sources were controlled botnets; 18% have conducted scanning, which is the preparation step for subsequent intrusions by collecting system information and vulnerability information of target machines; another 18% were marked by NTI as to have repeatedly conducted DDoS attacks because they contain vulnerabilities that can be remotely controlled and were left unfixed, or because they have reflection capability.
3.4.2Â Activity
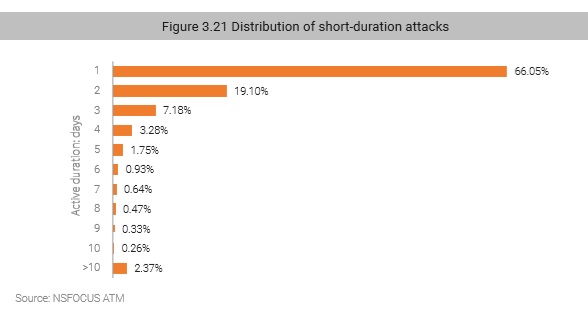
From monitoring of attack source activity, we see 10 days is a clear-cut divide for activity. Specifically, the proportion of attack sources active for less than 10 days is 98%, and that of attack sources active for more than 10 days (up to 280 days) is 2%. 95% of attack sources remain active for 1–5 days. This infers that in order to keep attack resources viable and prevent them from being blacklisted by defenders, attackers tend to use the hit-and-run strategy, specializing in multiple short attacks. Also suggested is that there are a wide range of vulnerable IP addresses on the Internet, making it easy for attackers to obtain such resources at a very low cost.
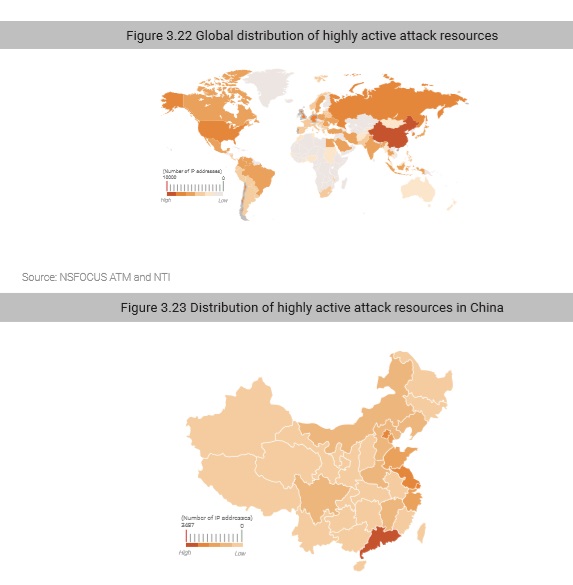
3.4.3Â Geographic Distribution
According to distribution of activity time of attack source IP addresses, attack sources active for over 10 days are regarded as highly desirable. They often contain an obvious security risk which is easily exploited, thus posing greater threats.
Globally, highly active attack sources are mostly distributed in China, the USA, and Russia. In China, they are mostly in coastal provinces and economically developed regions, such as Guangdong, Jiangsu, and Beijing. With a larger network infrastructure than other regions, even with similar protections, networks in these regions are more vulnerable than in other regions due to a much greater number of potentially vulnerable devices.
3.4.4Â IP Chain-Gang Behavior
IP Chain-Gang attacks refer to the large-scale attacks launched using certain attack methods through relatively monopolized attack resources. Unlike common attack events initiated by a single attacker, IP Chain-Gangs typically pursue intelligence and economic targets. Therefore, NSFOCUS feels that research into attack gang behavior based on their attack characteristics and history will be useful in predicting future IP Chain-Gang behavior. In the report, Behavior Analysis of IP Chain-Gangs9, recently released by NSFOCUS, we introduce the concept of modeling gang behavior based on gang size, attack traffic, attack count, and victims.
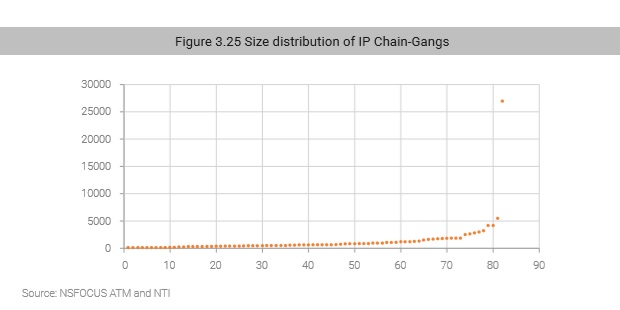
IP Chain-Gang Size
According to the overall distribution of gang sizes, most IP Chain-Gangs have less than 1000 members, except for one gang which has over 26,000 members.
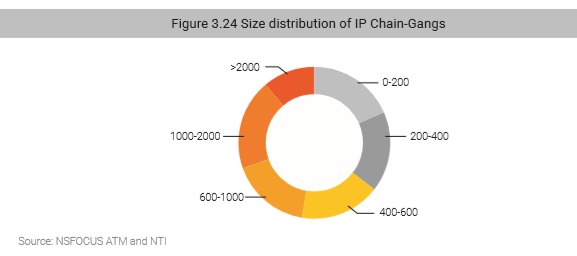
Figure 3.24 shows the size distribution of the IP Chain-Gangs identified by NSFOCUS. Each point represents a gang, with a total of 82 gangs found to date.
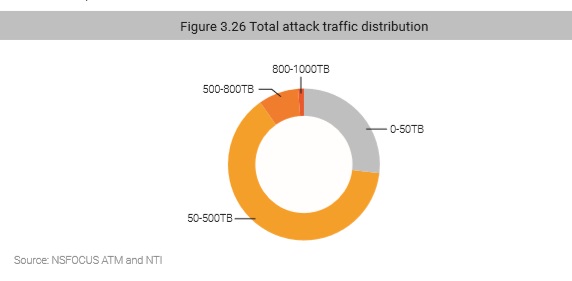
Total Attack Volume
The total attack volume of each gang includes the traffic generated by all attacks launched by each member. Though the total attack volume varies, the total attack volume of most IP Chain-Gangs has exceeded 50 Tbps.
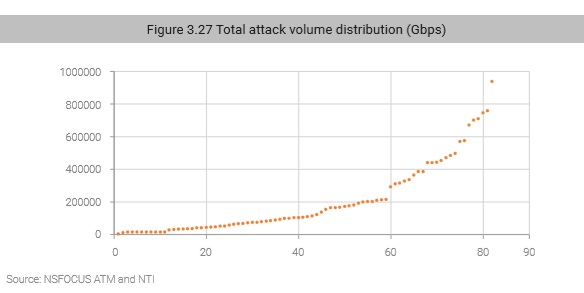
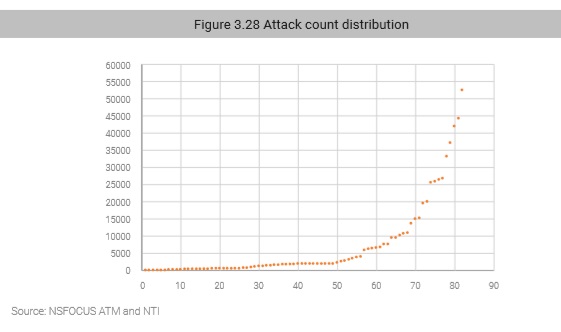
Attack Count
As shown in Figure 3.27, the number of attacks launched by each member of nearly 60 IP Chain-Gangs was less than 5000. It was somewhat surprising that 80% of all attacks were launched by only 20% of gangs.
to be continued