An abnormal increase in the CPU usage of a telecom carrier’s 4G firewall substantially slowed down the access from some iPhone users to the Apple website. We suspected that the carrier was hit by a DDoS attack. With the visualized traceback function of NSFOCUS Big Data Security Analytics (BSA), we made a drill-down analysis of suspicious IP addresses and finally located the attack source. This document details the entire DDoS traceback process and provides some analysis ideas.
Using an Eagle Eye to Trace IP Services
NSFOCUS Threat Analysis and Traceback (TAT) is capable of tracking traffic concerning websites, DNS services, and IP services. NSFOCUS TAT allows scenario analysis based on an IP address, IP segment, port, and protocol and presents the following statistics:
- Traffic and flow statistics by IP ports
- Traffic and flow statistics by visiting area
- Geographical distribution of visiting areas
- Geographical distribution of visiting areas by traffic intensity
- Concurrent Online IP addresses
- Traffic and flow statistics by access duration
- Pareto chart
- Traffic and flow statistics by protocol
- Traffic and flow statistics by router
An IP address traceback tasks can be performed in three ways: cache mining mode, online mining mode, and offline mining mode. During this attack, the eight to 12 pieces of DDoS data generated in one hour need to be analyzed and handled at a high speed.
- High-speed memory mining: The mined data, saved in the memory, can be quickly invoked and reused for progressive queries. Mining a big amount of data consumes a lot of cluster memory. Therefore, the cache mode is applicable only for mining data generated in one day. It is recommended that a filter be used to filter the data in advance.
- Online mining mode: After mining conditions are typed, a filter will be automatically generated accordingly. The filter directly queries the raw flow table without waiting for a cache to be created, thus making query to a specific analysis scenario fast and convenient. This mode is applicable to one-time queries of data generated within one day.
- Offline mining mode: This can be used for analyzing data generated within more than one day. The required data is first queried and then compressed (by combining small files). The created physical table is saved in the hard disk for future reuse. Due to the big amount of data, conditions should be configured, such as a specified IP address to be queried.
Analyzing Upstream Traffic of a Specific IP Address
Raw Data
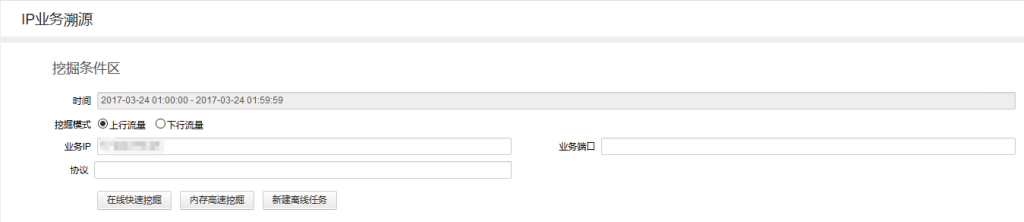
Under Service Analysis & Traceback > IP, we can mine an IP address’s upstream traffic data that was generated in 1:00–2:00 a.m. on March 24, 2017.

Mining conditions

Mined traffic statistics of an IP address
The graph in the preceding figure shows that the traffic trend changes slightly and the traffic is generally stable. The table under the graph shows that the peak size stands at 2.3 Mbps or 700 pps; the total volume is 3 GB or 1M packets; the total number of flows reaches 1013. The raw flow table presents statistics of raw flows such as the source IP address, destination IP address, source port, destination port, total volume, number of packets, and protocol.
Traffic and Flow of Ports
Under Service Analysis & Traceback > IP, we can click Traffic & Flow by Port to view the traffic and flow statistics of a website, thereby identifying the port with the peak traffic or abnormal traffic.

Traffic and flow statistics of IP ports
The graph in the preceding figure shows the traffic and flow trend of specific ports of an IP address in 1:00–2:00 a.m. on March 24, 2017. From the graph, we can see that only ports 443 and 760 were opened at that time. The table presents traffic and flow statistics of the two ports, such as the total volume, peak size, average size, and number of flows.
Traffic and Flows from the Perspective of TCP Flags
Under Service Analysis & Traceback > IP, we can click TCP Flag Traffic/Flows to view traffic and flow statistics from the perspective of TCP flags, such as the total volume, peak size, number of flows, and proportion of each type of traffic.

TCP flag-related traffic and flow statistics
The graph in the preceding figure shows the traffic and flow statistics from the perspective of TCP flags in 1:00–2:00 a.m. on March 24, 2017. From the graph, we can see that the highest peak size, 2 Mbps or500 pps, falls to ACK traffic totaling 1.6 GB or 519,000 packets and the second highest peak size goes to PSH-ACK traffic. Therefore, we conclude that ACK response packets and packets that contain the requested data account for a large proportion. The table presents detailed statistics about traffic and flow statistics from the perspective of TCP flags, such as the total volume and peak size.
Concurrent Online IP Addresses
Under Service Analysis & Traceback > IP, we can mine raw data for scenario analysis. After clicking Concurrent Online IP, we can learn the number of concurrent online IP addresses in 30 seconds, which have been deduplicated. This makes it convenient for users to check whether a problem is caused by a sudden increase of access IP addresses.

Statistics of concurrent online IP addresses
The trend graph in the preceding figure shows the trend of concurrent online IP addresses in 1:00–2:00 a.m. on March 24, 2017. From the graph, we can see that at a specific point of time up to 19 (maximum in the one hour) IP addresses were accessing the website simultaneously. Throughout the hour, the total number of IP addresses accessing the website reached 1001 which was within the acceptable range.
Analyzing Downstream Traffic of an IP Address
Raw Data
Under Service Analysis & Traceback > IP, we can mine raw data about downstream traffic of a specific IP address in a specified period, for example, 1:00 to 2:00 a.m. on March 24, 2017.

Traffic trend graph and table of an IP address in a specified period
The preceding figure shows downstream traffic data of an IP address in the period of 1:00–2:00 a.m. on March 24, 2017. Obviously, a burst of traffic occurs from 1:30 to 1:35 a.m. During the one-hour period, the traffic peaks at 626.4 Mbps or 1.1 Mpps and amounts to 65.1 GB or 102.7M packets; the total number of flows is 1427. The raw data table presents statistics about flows generated in that hour, including the source IP address, destination IP address, source port, destination port, traffic volume, number of packets, and protocol used.
Traffic and Flows from the Perspective of TCP Flags
Under Service Analysis & Traceback > IP, we can mine raw data for scenario analysis. After clicking TCP Flag Traffic/Flows, we can learn the total volume, peak size, and number of flows of packets with common TCP flags. In addition, we can analyze the proportion of each type of traffic distinguished with the TCP flag.

Traffic and flow statistics from the perspective of TCP flags
The preceding figure shows statistics from the perspective of TCP flags about traffic and flows generated in 1:00–2:00 a.m. on March 24, 2017. From this figure, we can see that FIN-ACK traffic exceeds all other types of traffic, peaking at 461.5 Mbps or 779.5 kpps and amounting to 51.4 GB or 86.9M packets. RST packets contributes the second largest proportion, peaking at 8.7 Gbps or 14.7 Mpps and amounting to 176.6 MB or 298.3K packets. Therefore, TCP connections are probably closed first and then reset. The table presents detailed traffic statistics from the perspective of TCP flags, such as the total volume and peak size.
Concurrent Online IP Addresses
In the case of traffic bursts, it is necessary to check whether there is a sudden increase in the number of access IP addresses. Under Service Analysis & Traceback > IP, we can mine raw data for scenario analysis. After clicking Concurrent Online IP, we can learn the number of concurrent online IP addresses in 30 seconds, which have been deduplicated. This makes it convenient for users to check whether a problem is caused by a sudden increase of access IP addresses.

Concurrent online IP addresses
The graph in the preceding figure shows the trend of concurrent online IP addresses in 1:00–2:00 a.m. on March 24, 2017. From the graph, we can see that at a specific point of time up to 21 (maximum in the one hour) IP addresses are accessing the website simultaneously. Throughout the hour, the total number of IP addresses accessing the website reaches 1178. There is no obvious sudden increase in the number of access IP addresses and therefore we think that access to the website in that hour is nothing abnormal.
Preliminary Conclusion – Downstream Traffic Contributing to the Traffic Burst
Our preliminary conclusion is that the traffic burst from 1:30 to 1:35 a.m. was caused by downstream traffic from the official website of Apple, which increased suddenly from 2 Mbps to 600 Mbps, including 461.5 Mbps FIN-ACK traffic and 176.6 Mbps RST traffic.
Statistics of downstream traffic by TCP flag
|
Traffic Type |
Total (Bytes/Packets) | Peak Size (bps/pps) | Avg Size (bps/pps) | Flows | Start Time | End Time |
| FIN-ACK | 51.4G/86.9M | 461.5M/779.5K | 14.3M/24.2K | 302 | 2017-03-24 01:00:07 | 2017-03-24 01:59:59 |
| RST | 8.7G/14.7M | 176.6M/298.3K | 2.6M/4.4K | 24 | 2017-03-24 01:04:30 |
2017-03-24 01:59:59 |
Drilling Data Down by Time (5-Minute Period)
Creation of a Time Filter
Drag the traffic burst area. Then the system automatically creates a time filter with the granularity of 5 minutes.

Dragging the traffic burst period to generate a time filter
Analysis of Traffic Details
The five-minute traffic trend provides a clearer picture about traffic generated in that period.

Traffic burst details
Analysis of Traffic Details from the Perspective of TCP Flags
From the distribution of traffic by TCP flag, we can further find out which TCP flags are most frequently seen in packets. In this case, FIN-ACK and RST packets contributed the largest proportion of traffic.

Details of bursting traffic from the perspective of TCP flags
Pareto Chart-based Analysis to Locate the Target and Find Suspicious IP Addresses
In the case of traffic bursts, we can create a time filter to analyze the bursting traffic more accurately.
Under Service Analysis & Traceback > IP, we can mine raw data for scenario analysis. After clicking Pareto Chart, we can define elements of flows for further analysis by using the precisely defined Pareto chart analysis method.

Pareto chart
The preceding figure shows the Pareto chart of traffic specific to an IP address in 1:30:04–1:33:03 a.m. on March 24, 2017. From the traffic graph, we can see that the source IP address and destination IP address on the top of the list contributed 99.68% of traffic. The statistics table also shows that the traffic between the two IP addresses amounts to 7.5 GB or 101.5M packets and peaks at 132.5 Mbps or 1.8 Mpps. Besides, the number of flows between them is also far greater than that for other IP addresses, which generated a very small proportion of traffic.
Analysis of the Destination IP Address
Having identified the destination IP address receiving abnormal traffic, we can perform a targeted analysis on this IP address after clicking TCP Flag Traffic/Flows and then creating a filter for this IP address.
![]()
Creating a filter
Under Service Analysis & Traceback > IP, we can mine raw data for scenario analysis. After clicking Query, we can learn the total volume, peak size, and number of flows of traffic to this destination IP address.

Traffic/flow graph and table

Detailed traffic/flow statistics
The preceding figures show traffic and flows specific to an IP address in 1:30:04–1:33:03 a.m. on March 24, 2017. From the traffic/flow table, we can see that traffic peaks at 624.7 Mbps or 1.1 Mpps and amounts to 60.1 GB or 101.5M packets. Then from the detailed traffic/flow statistics, we can see that all downstream traffic related to the aforementioned source IP address and destination IP address was from port 443 to port 9069 and a traffic burst occurred. Obviously, the problem was attributable to this pair of IP addresses.
Conclusion
1. A telecom carrier’s firewall reported an exception as a result of an Intranet IP address accessing an IP address of Apple.
2. We conducted a comparative analysis of the upstream and downstream traffic in the period of 1:30–1:35 a.m. It turned out that, in that 5 minutes, an intranet IP address received downstream traffic of 624 Mbps from Apple, in contrast to the upstream traffic of only 21 kbps.

Upstream traffic statistics

Downstream traffic statistics
3. We found that traffic between the source IP address and the destination IP address experienced a sudden increase in a short period, and all was from port 443 of Apple to port 9068. In addition, some types of packets contributed a large proportion of the DDoS traffic. Therefore, it is likely that communication between these two IP addresses was the cause of the problem.
4. Analyzing traffic from the perspective of TCP flags, we found no SYN packets in upstream traffic. In downstream traffic, FIN-ACK traffic peaked at 461.5 Mbps and RST traffic peaked at 176.6 Mbps.
5. The two IP addresses, according to NSFOCUS Threat Intelligence (NTI), are both safe and have never been involved in any DDoS events.
The next step is to analyze the involved IP address under protection of the firewall and determine which type of devices uses port 9069. (The telecom carrier’s log system should have related messages.)