
The artificial intelligence (AI) technology based on deep neural networks has made breakthroughs in a wide range of fields, but only seen limited adoption in cybersecurity. At present, it is impractical to expect a hierarchical neural network to implement threat identification, association, and response from end to end. According to Zhou Tao, an algorithm expert, AI can hardly play its role in threat detection for the following reasons:
- Machine learning is good at detecting behavior of normal patterns, but intrusion is a type of behavior deviating from the normal.
- Possession of big data is not equivalent to control of large quantities of labeled data. Unsupervised learning delivers inaccurate data.
- Threat detection is an open-ended issue as the loss function is very difficult to define.
- There is a permanent pursuit of accountable results.
Zhou’s explanations touch upon the model, data, and usage scenarios, providing a penetrating insight into why machine learning, especially deep learning, cannot fit in well with security modeling. However, deep learning and machine learning are not all AI is about. In cyberspace, deep learning and machine learning, when used with intelligent threat analytics platforms with capabilities of anomaly awareness, event inference, and threat response, can serve as normal data processing tools rather than core capabilities.
Data is fundamental to AI availability, which has never changed. The typical intelligent application model of “cognition – perception – action” also acts on data. Now comes the question: To build up more automated, more intelligent threat analytics capabilities, what kinds of data should we collect and analyze and how should we organize such data?
1. DIKW Pyramid
Security defense objectives, such as advanced persistent threat (APT) identification/tracking, attack attribution, threat hunting and response, group analysis, and situational awareness, go far beyond the application scope of traditional isolated detection systems. Application logs, host logs, network logs, detection event logs, asset information, assessment results, and business-level employee information have gradually been incorporated into security information and event management (SIEM) and user and entity behavior analytics (UEBA) solutions. At the same time, threat intelligence has become a must-have for detection capabilities. Access to and association of multi-source heterogeneous data provide full support for incident visualization, detection, inference, response, and governance. With more and more data accumulated, detection and association capabilities constantly improved, and response capabilities increasingly automated, vendors begin to consider development of intelligent security for more applicable automatic capabilities of inference around security data.
To develop intelligent security, the first step is to organize data. Let’s see how the DIKW pyramid[1], also known as the DIKW hierarchy, represents the relationships between data, information, knowledge, and wisdom.
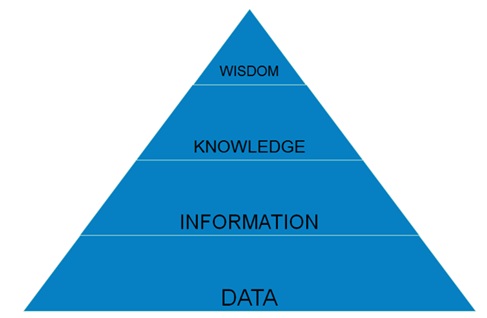
DIKW pyramid
It is a long way from data to wisdom. Luckily, over years, the development of the security industry driven by numerous battles between attackers and defenders has laid the solid foundation for us to march towards intelligent security. Based on the DIKW pyramid, we roughly divide common security data into the following layers:
- Data layer (unprocessed raw data): application logs, host logs, network traffic logs, honeypot logs, network architecture data, and service-layer data
- Information layer (meaningful and time-sensitive processed data based on rules and behavior): logs of various detections, including single-source detections and associated detections; various assessment logs, including asset data and vulnerability data obtained in an unsolicited manner; threat intelligence
- Knowledge layer (summarized information available for deduction and inference): various specifications and knowledge bases, such as Common Weakness Enumeration (CWE), China National Vulnerability Database of Information Security (CNNVD), Common Attack Pattern Enumeration and Classification (CAPEC), and Adversarial Tactics, Techniques and Common Knowledge (ATT&CK)
The preceding classification reveals to what extent resources currently in hand can be used for security data analysis. In the context of security data analytics, the term “data” indicates all digital resources used, including the combination of the three layers of data, information, and knowledge. The DIKW pyramid depicts the hierarchical structure of data, presenting data processing in cybersecurity in a most direct manner.
2. Use of Graph Models to Organize Data
The objective of intelligent threat analytics should not be to resolve all cybersecurity issues for humans, but to deliver an expert system that maximizes automation of security data analytics and determination of and response to threats/incidents to deepen people’s perception of security data, reduce costs incurred for people’s acquisition of more information and knowledge, and improve people’s capabilities of acting on threats. The ultimate goal is to shift cybersecurity from reactive response to proactive action. According to Professor Li Kang of the University of Georgia, many vendors outside of China are stepping up deployment of intelligent security techniques, in hopes of creating an ecosystem to absorb more extensive data, thus bringing cybersecurity to a higher level. In fact, obtaining data is not the focus of intelligent threat analytics. Instead, how to organize and use data is the core of the technique.
The network environment is characterized by a graph structure. Therefore, network security issues have a natural connection to graph data structures and graph algorithms.
Since Google’s proposal of the concept of knowledge graph, intelligent application solutions based on related techniques have been widely used in recommender systems, Q&A systems, search engines, social networks, and risk control fields. In the cybersecurity realm, the most common graphs are the asset relationship graph and attack vector graph on the UI of various security products. As for data association and inference based on graphs, a lot of efforts are being made in this aspect, both in and outside of China. When we search the Internet via Google with a combination of “graph” and “security”, results returned by the search engine are almost all about Microsoft Intelligent Security Graph (MISG).
Featuring full integration between the cloud ecology and platforms and links to multi-source and multidimensional data, MISG provides all-round threat-related information and relies on cloud-side analytics to implement real-time threat detection. In addition, it provides an application programming interface (API) for fast integration. At RSA Conference (RSAC) 2019, the security team of Microsoft familiarized the audience with the concept of data gravity as well as detection- and behavior-based threat analytics algorithms powered by machine learning for use in the cloud environment, which can effectively assess the risk of events.
Sqrrl Data, Inc. (acquired by Amazon in January 2018) provides a threat hunting platform, at whose heart is its Behavior Graph, which, in combination with UEBA, uses behavior evaluation and associated data to enable in-depth investigation of threats. MITRE, a company initiating and establishing multiple threat model knowledge bases (CAPEC, CWE, ATT&CK, …) and developing related languages and specifications (Structured Threat Information eXpression (STIX) 1.0, Trusted Automated eXchange of Intelligence Information (TAXII) 1.0, …), has delved into graph modeling of security data. CyGraph[2] is a prototype system developed by MITRE for graph model studies. With a hierarchical structure, CyGraph provides graph data at four levels, namely network infrastructure, security posture, cyber threats, and mission dependencies, to support attack surface identification and situational awareness in the face of cyberattacks for protection of mission-critical assets. Another example of projects aiming to build a unified analytics graph structure upon multi-source security data is Cauldron[3].
This tool normalizes vulnerability scanning and assessment results and can parse firewall rules of various formats. With a correlative analysis of the network topology, it can effectively capture dynamic changes in the attack surface. In China, there are also more and more products and researches focused on graph-based analytics around security data.
For example, NSFOCUS, based on a knowledge graph, has designed a number of subjects for modeling of various threats across the network. NSFOCUS’s threat model is compatible with MITRE’s models, including CAPEC, Malware Attribute Enumeration and Characterization (MAEC), and ATT&CK, and so can extract critical information from multi-source threat intelligence as knowledge to expand the knowledge graph. Another example is Alibaba, an IT giant in China, who uses clustered raw alert data to generate directed attack graphs and prioritize alerts and discover attack scenarios based on the mapping onto kill chain phases, distribution of assets on the network, and weighting of related edges.
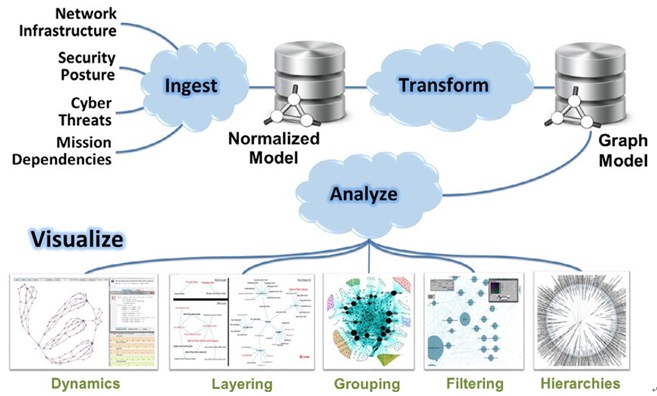
CyGraph architecture
Nowadays, cybersecurity data keeps increasing in dimension and size. A systematic method for organizing data is in urgent need to incorporate as much available information as possible into a whole. Traditional data organization methods based on relational databases can hardly cope with complicated relationships in graphs.
Organizing data into a graph structure can give full scope to the graph property of security data, enhancing the efficiency of data storage, mining, and retrieval. The graph gene contained in the cybersecurity data structure is not only the basis of data visualization but also the basis of intelligent security focused on addressing threats in the cyberspace. Then what data graphs are required for building up intelligent threat analytics capabilities?
3. Use of Key Data Graphs to Build Up Intelligent Threat Analytics Capabilities
Current access to large-scale, multidimensional cybersecurity big data brings new opportunities for us to handle cyber threats. In the meantime, choosing and handling security data sources under a unified standard in the context of limited available resources becomes especially important. With the given cyberspace as the battlefield and protection of assets (whether physical or virtual) and crackdown on threat actors as the objectives, intelligent threat analytics should collect data to create the following key data graphs, which are different from the hierarchical model of DIKW and the security/mission knowledge stack structure of CyGraph:
- Environmental data graph: including information about assets, vulnerabilities in assets, files, users, and IT system architecture
- Behavioral data graph: including network-side detection alerts, device-side detection alerts, file analysis logs, application logs, honeypot logs, and sandbox logs
- Intelligence data graph: including threat intelligence collected from various external sources
- Knowledge data graph: various knowledge bases such as ATT&CK, CAPEC, and CWE
Various types of security association data (not limited to the preceding four) have been adopted in many big data analytics scenarios, though often in an isolated or partial manner because of lacking a unified standard to represent the classification and use pattern of such data. Based on practices in analyzing and dealing with cyber threats, the preceding four types of data are organized in the form of graphs to associate data of the same type and data of different types, covering fundamental tactical requirements of cyber warfare for control of the environment, understanding of threat actors’ motives, integration with external intelligence, and accumulation of basic knowledge.
Though independent, the four graphs are associated with one another via entities of a specified type, thus ensuring clear representation of data while achieving global linkage. The following sections dwell upon why the four data graphs are necessary for development of intelligent security.
(1) Environmental data graph
“Environment” can be seen as various types of entities in the protected cyberspace and properties of these entities as well as connections between these entities.
To create an environmental data graph, one needs to use asset management, vulnerability management, and risk assessment tools/services and have such business data as information about the enterprise, IT system architecture, and human resources to diversify and link environmental entities.
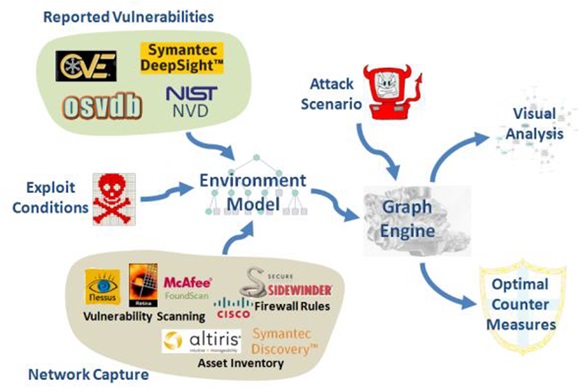
Cauldron’s graph-based vulnerability analysis
Security is not just about deployment of more layers of firewalls or allocation of more budget to cope with DDoS attacks that may occur anytime. To what extent an organization has assets, asset vulnerabilities, user information, and IT architecture information in control usually determines how well it will be able to withstand cyberattacks. Axonius, a provider of the asset management platform solution, walking away with the title of “Most Innovative Startup of 2019” at the RSAC Innovation Sandbox seems to be a reminder that asset management solutions are far from mature as expected.
In the context of cloud computing, IoT, and mobile Internet gaining momentum for rapid growth, assets are increasing sharply in number and type, and along with it comes more vulnerabilities, aggravating the threat landscape that is already gloomy. As a matter of fact, “knowing oneself” is more crucial than “knowing the enemy”.
This is because both assets exposed on the Internet and the “dark assets” not put under management will add to the risk of exposure to threats. To address the ubiquitous threats, it is important to identify critical entities and relationships that matter to security. Before and after an event, it is necessary to assess how extensively and intensively the threat will potentially impact the system or network in an all-round manner. Only in doing so, can we accurately identify the attack surface.
(2) Behavioral data graph
“Behavior” can be seen as actions of entities that can be collected and detected in the protected cyberspace. Behavioral data can be raw log data indicated in the data layer of the DIKW pyramid, and can also be various detection alert logs and clustered alert logs at the information layer.
A marriage of UEBA and SIEM can well address the requirements for collection of behavioral data.
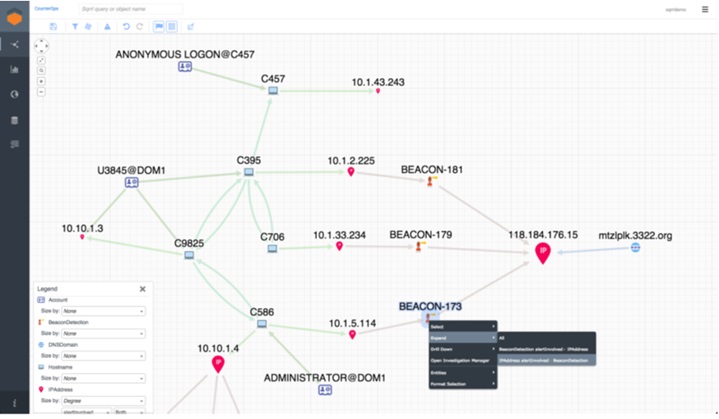
Sqrrl: Behavior Graph
The importance of the behavioral data graph is self-evident. It delineates in every detail the trajectory of activities throughout the cyberspace by incorporating behavioral data from endpoints to networks, from borders to interiors, and from rules to statistical machine learning.
It is the prerequisite for identification, classification, response, and traceback tasks. An inference method of generating new alert events by using clustering rules of multiple behavior sequences has been adopted in different scenarios. It should be noted that association of behavior should not be limited to clustering of behavior of individual entities. In fact, association of multi-entity behavior in a long time is the objective of data analytics. From the perspective of handling and storage efficiencies, organizing behavior vectors of multiple entities into a graph model structure is an inevitable path to behavior association.
The granularity of behavioral data collection, to a great extent, depends on the current collection and detection capabilities.
In this regard, behavioral data collection should be as inclusive as possible as long as normalization and systematism are ensured. The major difference of the behavior graph from the environment graph, knowledge graph, and intelligence graph is that the behavior graph is effective in a shorter period, with a higher frequency of updates and additions.
To bring the behavior graph to its fullest potential, it is crucial to properly construct the ontology model and link entities of behavioral data, design interactive capabilities between behavior and environments/knowledge, and manage data throughout the lifecycle.
(3) Intelligence data graph
Different people may interpret threat intelligence differently. In this document, intelligence has the same meaning as defined in the Market Guide for Security Threat Intelligence Services released by Gartner in 2014: Threat intelligence is evidence-based knowledge, including context, mechanisms, indicators, implications and actionable advice, about an existing or emerging menace or hazard to assets that can be used to inform decisions regarding the subject’s response to that menace or hazard. According to this definition, threat intelligence and knowledge bases, though with different focuses, have something in common.
Threat intelligence can broaden security teams’ horizon of threats and improve their capabilities of proper decision-making on security incidents by providing more threat context. Currently, threat intelligence has become important strategic and commercial resources applied in a variety of fields, including security operations, situational awareness, threat analytics, risk assessment, and attack attribution.
It should be noted that different threat intelligence providers may understand threat intelligence at different levels and from different perspectives. A useful intelligence data graph should be inclusive, accurate, and time-sensitive. To enhance the efficiency and usefulness of such a graph, the key is to select scenario-specific threat intelligence sources for drawing of a special-purpose data graph.
(4) Knowledge data graph
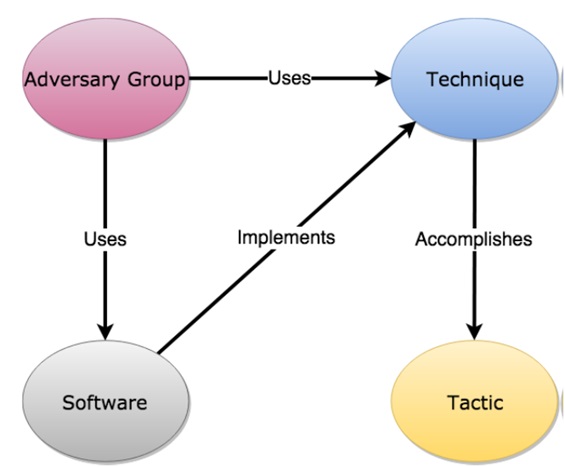
ATT&CK model relationships[4]
Knowledge and intelligence overlap conceptually in certain scenarios. This document takes inductive, time-insensitive security data that can be used for inference as knowledge data, including various knowledge bases, such as ATT&CK and CAPEC, and enumeration databases, such as CWE, Common Vulnerabilities and Exposures (CVE), and CNNVD. The construction of a knowledge base requires expert experience and collection, verification, and abstraction of threat intelligence.
The abstracted concepts and relationships are the common basis of modeling. Today, knowledge base construction for knowledge sharing has become a common understanding in the security industry.
Knowledge data graphs can provide correlative knowledge of threats in particular environments and scenarios, enabling security devices to assess the extent and depth of a threat’s impact, generate alerts on potential threats, and recommend appropriate countermeasures. Threat/Incident analytics enabled by knowledge graphs can expand the concept and data context of associated entities in behavior, environment, and intelligence graphs and is truly interpretable, deducible, actionable, and reusable automated, intelligent analytics. Unlike commercial threat intelligence, knowledge bases are built upon public or open-source project data.
Organizations at home and abroad have made a lot of efforts to develop more extensive, more professional threat-related knowledge bases, such as CAPEC, CVE, CNNVD, and ATT&CK. In this respect, it is also advisable to use knowledge graph techniques to automatically extract multi-source data for knowledge graphs and expand these knowledge graphs by means of relational reasoning.
4. Conclusion
We are studying intelligent cyber threat analytics not for the purpose of devising a dazzling concept or developing a one-size-fits-all AI security model.
On the defensive side, what we need is a unified, highly automated platform and tool chain that can receive and feed massive multi-source heterogeneous data, enabling security devices to promptly detect, infer, respond to, and track threats and helping people conduct security operations, research, and mitigations. This document, as part of our efforts to further the research on “intelligent” security, draws upon our past experience and reclassifies common data sources in cybersecurity data analytics before proposing four key data graphs in terms of environments, behavior, intelligence, and knowledge necessary for graph modeling involved in development of an intelligent security platform.
Of course, a usable, scalable data graph structure needs infrastructure support for data processing and storage. More importantly, it should ensure data associations and interactions within a graph and across different types of graphs.
This, on the one hand, requires systematic design and optimization of the oncology database (including entity types, relationships, and attributes), that is, the structured conceptual template at the schema layer of the graph architecture; on the other hand, requires a unified, scalable standard and language (such as STIX, MAEC, or Information security technology—Cyber security threat information format) to describe instances at the data layer of the graph architecture and a unified interface for data interactions. In addition, associations between data of different layers should be named and classified in a normalized manner.
For example, custom IoC detection alerts should be mapped to specified nodes in the knowledge base. These efforts are, by nature, a challenge to the traditional cybersecurity architecture and implementation. Finally, to reshape the cybersecurity ecology, we should establish industry standards for intelligent security around data, technology, architecture, and regulations.
Only in doing so, can we be poised for the era characterized by extensive sharing of and interactions around big data of security and disseminate wisdom across the industry.
References:
- Rowley, J. The wisdom hierarchy: representations of the DIKW hierarchy[J]. Journal of information science, 2007, 33(2): 163-180.
- Noel S, Harley E, Tam K H, et al. CyGraph: Graph-Based Analytics and Visualization for Cybersecurity. Cognitive Computing: Theory and Applications Elsevier, 2016.
- Jajodia S, Noel S, Kalapa P, et al. Cauldron mission-centric cyber situational awareness with defense in depth[C]. MILCOM 2011 Military Communications Conference, 2011. 1339-1344.
- MITRE ATT&CK: Design and Philosophy (https://www.mitre.org/publications/technical-papers/mitre-attack-design-and-philosophy)