
Honeypot-captured Threats in 2020 H1
In terms of honeypot-captured threats, in 2020 H1, Internet attack activities mainly consisted of malicious scanning, over 50% of which were attacks on or scanning of port 443. As for exploits, most attacks were directed at Power cameras, Dlink routers, and JBoss servers. Weak password attacks were mainly launched from the Netherlands, Russia, Seychelles, Moldova, and the USA. DDoS reflection attacks were dominated by DNS, CLDAP, and NTP service attacks, and NTP reflections accounted for nearly 40%. 2020 H1 witnessed the capture of more than 24 million DDoS reflection attacks, of which the longest duration was about 86 hours.
Attack Overview
Of the 611,769,657 pieces of data collected in 2020 H1, 97.35% (231,297,760) were about malicious connections, followed by exploits (1.55%) and brute-force attacks (1.10%), which were 3,678,706 and 2,613,089 respectively. Malicious samples from 14 platforms were captured. The malicious downloadguide family held the highest proportion, reaching 35.26%.
Proportions of Attack Types in 2020 H1
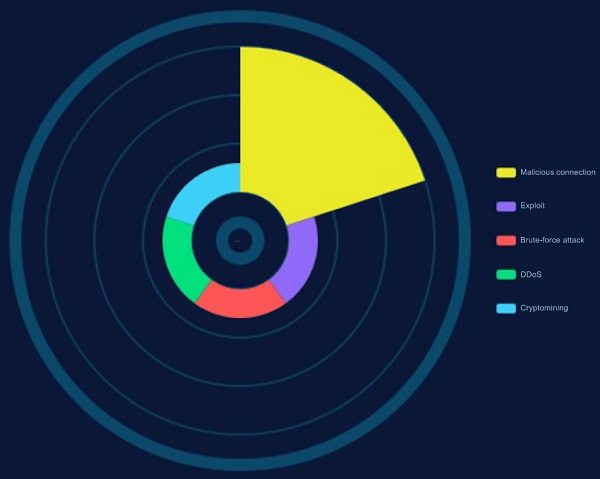
Figure 2-4 Proportions of attack types in 2020 H1

Figure 2-5 Change trend of high-risk port attacks in 2020 H1
Ranking of Exploits in 2020 H1
Table 2-6 Exploit count of vulnerabilities in 2020 H1

Threat Awareness Services Across the Whole Network
Of all threats facing application services, those targeting port 433 took up more than 50%, and remaining involved the mDNS vulnerability for port UDP 5353, port NetBIOS 137, game port 27015, and port Memcache 11211, as shown in Figure 2-6.
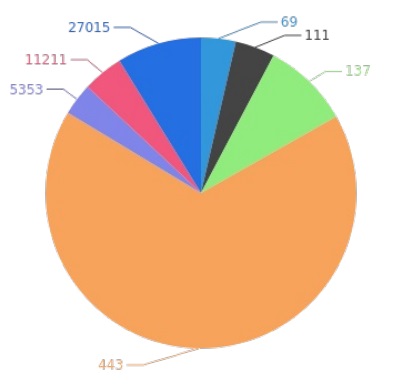
Figure 2-6 Distribution of application service threats
- Brute-Force Attacks
2020 H1 saw the capture of 300,373,397 pieces of data, 451,199 of which were about user name/password pairs. The top 5 exploited user name/password pairs are as follows.
Table 2-7 Exploit count of user name/password pairs
| User Name/Password Pair | Exploit Count |
| root_admin | 20,564,126 |
| root_None | 6,639,143 |
| nproc_nproc | 663,805 |
| admin_admin | 57,627 |
| root_root | 49,999 |
Table 2-8 Common passwords used by attackers
| Password | Device | Password Complexity | Exploit Count |
| admin | Common | Too simple | 20,647,020 |
| None | Common | Too simple | 6,682,366 |
| nproc | Common | Too simple | 663,805 |
| 123456 | Common | Too simple | 421,153 |
| 123 | Common | Too simple | 177,674 |
The top 5 countries/regions with login attempts are as follows.
Table 2-9 Top 5 Countries suffering brute-force attacks
| Attacked Country | Attack Count |
| Netherlands | 144,942,075 |
| Seychelles | 23,088,226 |
| Russian Federation | 19,969630 |
| Moldova | 19,677,162 |
| USA | 17,597,244 |
- Intrusion Behaviors
External attackers in the threat hunting system use the following commonest commands.
Table 2-10 Common commands
| Command | Type of Intrusion Tools | Usage Count |
| cat /proc/cpuinfo | grep name | wc -l | External command | 686,498 |
| cat /bin/busybox | External command | 180,643 |
| /bin/busybox cat /bin/busybox | External command | 150,244 |
| /bin/busybox TSUNAMI | External command | 150,182 |
| echo -en \x45\x43\x48\x4f\x44\x4f\x4e\x45 | Tool embedded in the system | 143,927 |
Table 2-11 Top 5 attack IP addresses
| Attack IP Address | Attack Count |
| 5.188.86.168 | 8,897,556 |
| 5.188.86.165 | 8,622,362 |
| 5.188.86.167 | 8,132,853 |
| 5.188.86.164 | 7,776,140 |
| 5.188.87.49 | 7,695,391 |
Global Distribution of Attack IP Addresses
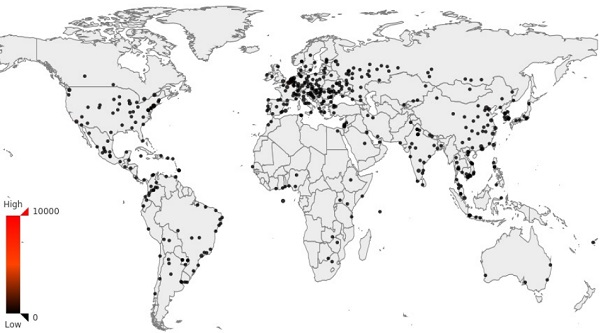
Figure 2-7 Global distribution of attack IP addresses
The captured 22,784 samples involved 48 families and 43 download addresses. Family proportions in malicious samples are as follows:
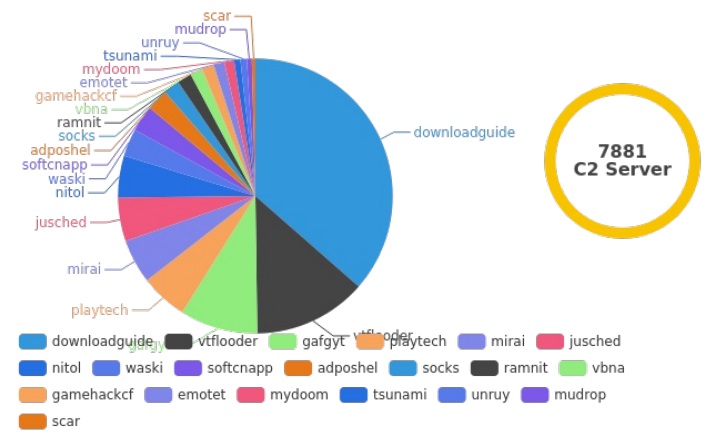
Figure 2-8 Proportions of malicious family samples
- Email Attacks
In 2020 H1, we captured a total of 330,893 emails, of which 5141 were spam and 325,752 were phishing emails. We captured 7959 IP addresses from different sources. The attacks involved 2,102,120 destination emails.
Table 2-12 Targeted email addresses
| Usage Count | |
| spameri@tiscali.it | 4314 |
| emeka@malatrade.com | 2815 |
| toronto20000b@outlook.com | 371 |
| usgovtax@zohomail.com | 329 |
| vinbetonn@outlook.com | 328 |
Table 2-13 Targeted email service providers
| Email Service Provider | Usage Count |
| yahoo.com | 454,993 |
| gmail.com | 274,926 |
| aol.com | 220,067 |
| hotmail.com | 189,272 |
| msn.com | 43,264 |
- Application Vulnerability Exploits
In 2020 H1, we captured 4,819,491 pieces of data, including 275,055 about exploits.
Database Services
We captured 4,819,491 source IP addresses, of which 6576 were from MySQL, 83,035 from MS SQL, 6701 from Redis, and 6701 from non-relational databases. 4115 user name/password pairs were exploited in brute-force attacks. These IP addresses also involved 15,585 kinds of source client software.
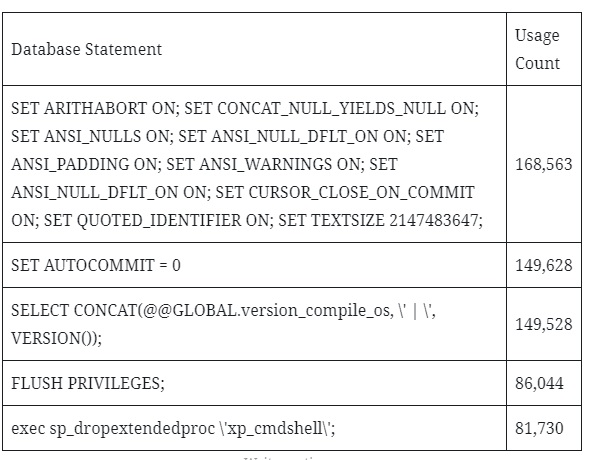
Table 2-14 Database statements most frequently used by attackers
- Web Services
In 2020 H1, we captured 51,730,540 pieces of data, which involved 313,743 source IP addresses, 19,969 source User Agents, 310,992 request paths, and 12 kinds of service.
DDoS Reflection Attacks
Among DDoS reflection attacks, DNS services were most frequently attacked in May. Of all 24,794,034 attacks, those targeting 2.185.238.144 accounted for the largest proportion, lasting 86.08 hours.
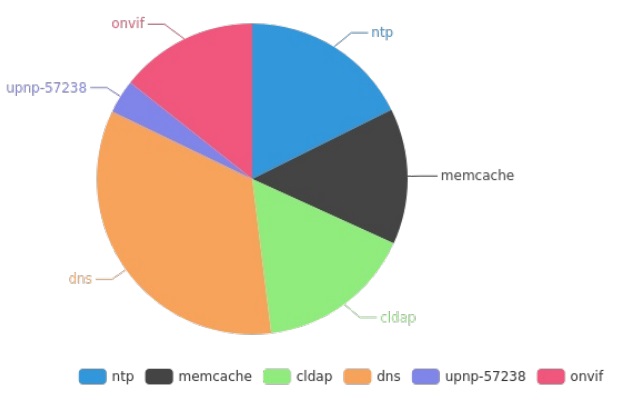
Figure 2-9 Distribution of DDoS reflection attacks by service
The distribution of source IP addresses of reflection attacks is as follows:
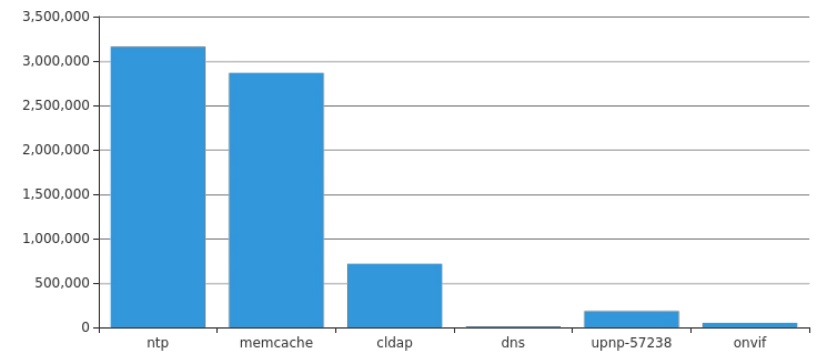
Figure 2-10 distribution of source IP addresses of reflection attacks by service
IoT Services
6,462,645 attack payloads targeted IoT services, involving 20 devices and seven services. Besides, 313,743 attack IP sources were captured, which came from 208 countries and regions. The following figure indicates the IP quantity trend:
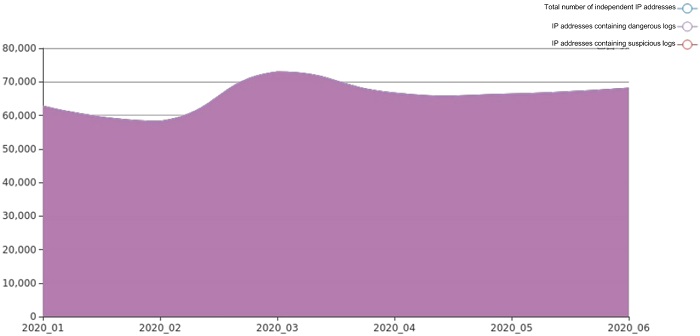
Figure 2-11 IP quantity trend
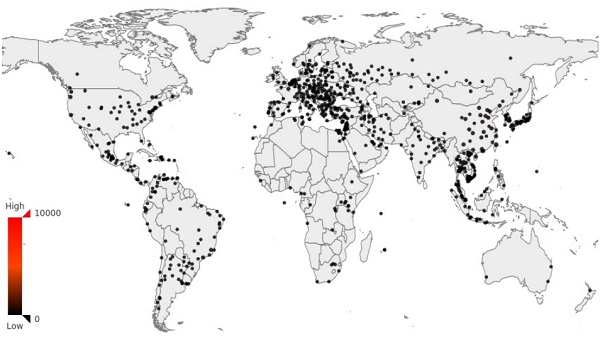
Figure 2-12 Global distribution of attacked IP sources
Cryptomining Botnet Trend
Through NSFOCUS’s threat hunting system, we have kept an eye on a botnet specializing in Monero cryptomining for a long time. The botnet intrudes upon hosts by cracking weak passwords and gains control privileges by implanting bot programs. Meanwhile, it downloads and executes Monero cryptomining scripts via the downloader for malicious cryptomining.
The cryptomining botnet became increasingly active in 2010 H1, involving a total of 20,830 active bots. China was the country with the most bots, which were as many as 8304, accounting for 40% of the total. Port 22 was opened on 13,664 bots, approximately 66% of all bots. According to known asset intelligence, routers and cameras were dominant device types reduced to bots. As for cracked weak passwords, this botnet used nproc-nproc most frequently. Details are as follows.
- Activity
According to statistics about monthly active bots, we can learn how active the botnet was in 2020 H1. As shown in Figure 2-13, this botnet became increasingly active in 2010 H1. June saw the most bots, which were as many as 10,133.

Figure 2-13 Activity of the cryptomining botnet in 2020 H1
- Geographical Distribution of Bots
We conducted a geographical analysis of cryptomining bots and figured out top 10 bot countries. As shown in Figure 2-14, China was the country with the most bots, which were as many as 8304, accounting for 40% of the total.

Figure 2-14 Top 10 countries in terms of the number of bots
- Distribution of Ports Opened on Bots
We paid attention to the distribution of ports opened on these bots. As shown in Figure 2-15, top 10 ports opened on these bots were ports 22, 80, 443, 3306, 21, 8080, 123, 3389, 53, and 25. Port 22 took the first place, covering approximately 66% of all bots.
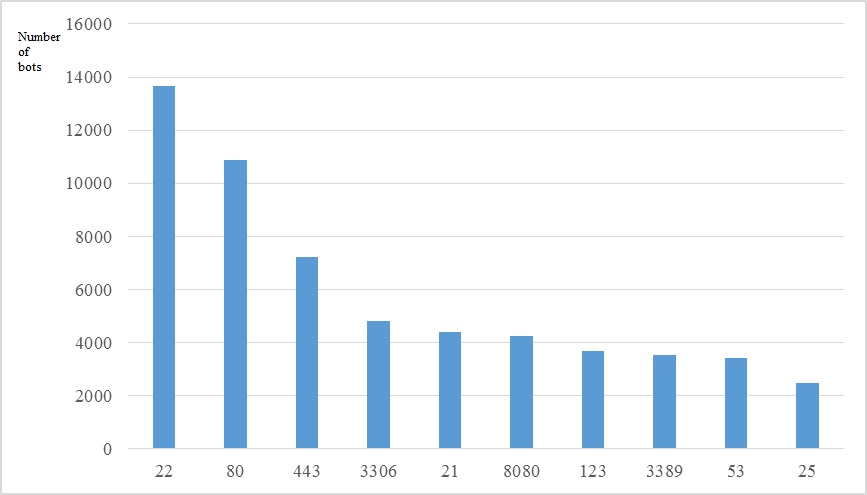
Figure 2-15 Top 10 ports opened on bots
- Distribution of Bot Devices by Type
According to known asset intelligence, 9% of these bots were IoT devices. As shown in Figure 2-16, 35% of these IoT devices were routers, and 29% were cameras.

Figure 2-16 Distribution of Bot Devices by Type
- Cracked Weak Passwords
By launching attacks via weak password cracking, attackers gained unauthorized access to and intruded upon hosts. Top 5 weak passwords are shown in Figure 2-17. nproc-nproc is the weak password most frequently used by the cryptomining botnet.
Figure 2-17 Top 5 weak passwords
| Ranking | User Name/Password | Usage Count |
| 1 | nproc-nproc | 220,182 |
| 2 | 123456-root | 177 |
| 3 | root-1234 | 101 |
| 4 | zd-123456 | 66 |
| 5 | root-password0 | 66 |
- Countermeasures
We find that most cryptomining botnets are spread mainly by scanning ports and cracking weak passwords. Therefore, the repeatedly discussed issues of key vulnerability fix and weak password intrusion are still noteworthy. Again, users who are concerned about the security of their networks/systems are advised to note the following:
- Raise the awareness of security issues concerning weak passwords in Telnet and other services and use strong passwords.
- Deploy necessary security software and hardware products to secure systems.
- Install patches and fix vulnerabilities without delay to avoid exploits.
- Check all service ports that are opened and close unnecessary ones.