Attack Gang Size
Gang Size
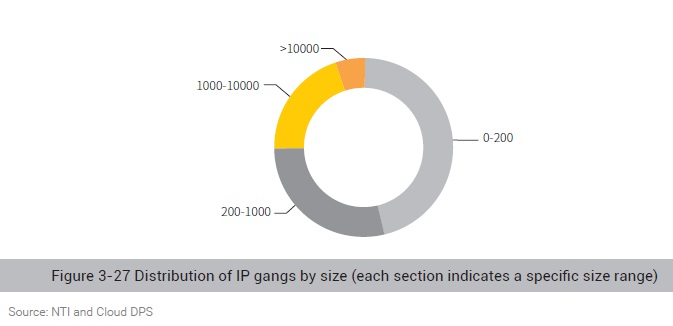
Figure 3-27 shows the distribution of our identified IP gangs by size. Two gangs consist of over 10,000 members and the largest gang has 88,000 members.
Total Attack Traffic
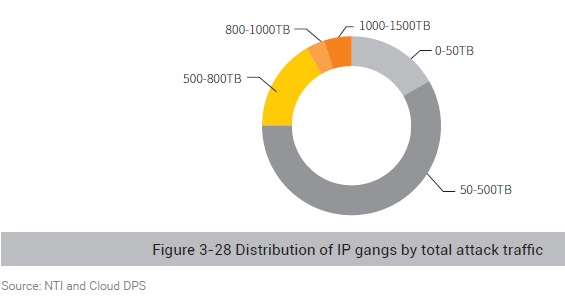
Figure 3-28 shows the distribution of IP gangs in terms of traffic generated by all members of a gang. As for the total attack traffic, a big gap seemingly existed in different gangs. However, most
gangs produced a total of more than 50 TB, with the largest total traffic of one gang hitting 1500 TB.
Largest Gang by the Number of Attack Sources
In 2019, the largest gang with most attack sources was also the most active gang. This gang has 88,000 recidivists and its attack source device composition has a distinctive characteristic:
According to asset intelligence from NTI, 31% of devices in this gang were IoT devices (28,000), 64% of which were routers (94% from MikroTik). This gang was active in the whole year, using 35,000 attack sources to hit 83 targets on average each month.
Activity Distribution
Figure 3-29 shows the monthly quantity trend of attack sources and attack targets of this gang. On average, 350,000 active attack sources launched attacks against 83 target each month. The
quantity of attack sources of this gang fluctuated from month to month because some members will leave (the possible reason is that the system owner has removed the malware and fixed the
security vulnerability exploited by the attack controller for system intrusion) while new members will join the gang (new systems are infected with malware and become botnet members).

As shown in Figure 3-30, the x-axis indicates the date (by day) and the y-axis indicates IP addresses of attack targets. A red spot indicates that this gang hits an IP address on a specific date. The size of a red spot represents the number of IP addresses of attack sources. The more intensive and greater the red spots are, the more active the gang is, that is, frequently performing DDoS attacks in a coordinated way. From the following figure, it can be seen that this gang stayed active throughout the year. Up to 11,300 attack sources in a gang hit one target at the same time in one day, a record high in a single day in 2019.

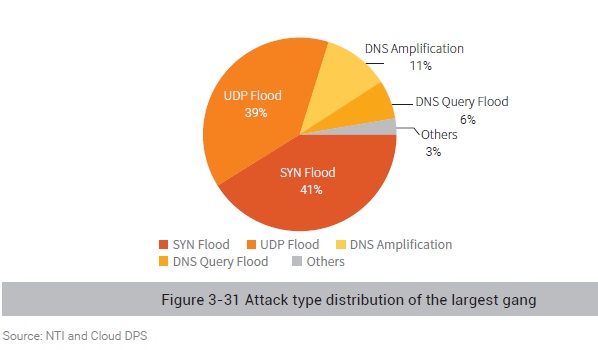
Attack Type Distribution
Figure 3-31 shows the attack type distribution of the largest gang. We can see that this gang mainly resorts to SYN flood and UDP flood attacks.
Distribution of Attack Sources
According to asset intelligence from NTI, IoT devices accounted for 31% of attack sources. Of all such IoT devices, 64% were routers and 94% of those routers were provided by MikroTik. In recent
years, two vulnerabilities, CVE-2018-14847 and CVE-2019-3924, have been released for MikroTik. IoT devices are increasingly becoming favored zombies of hackers because they always stay
connected, contain vulnerabilities that cannot be fixed in a short time, and are easily to break into and control.
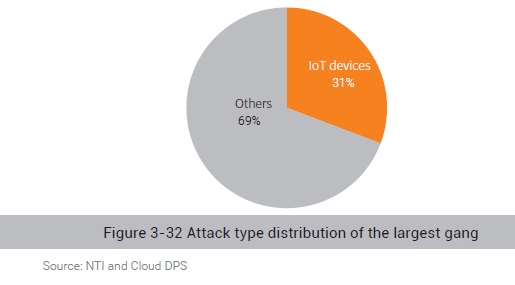
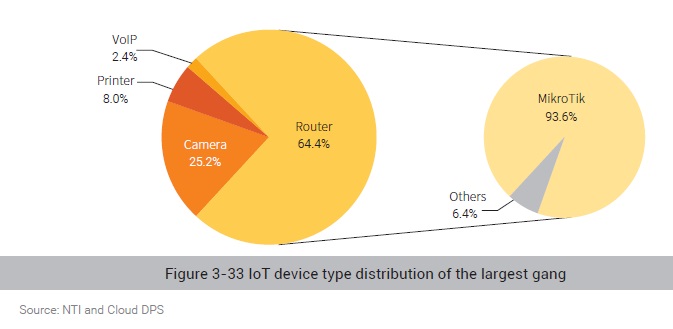
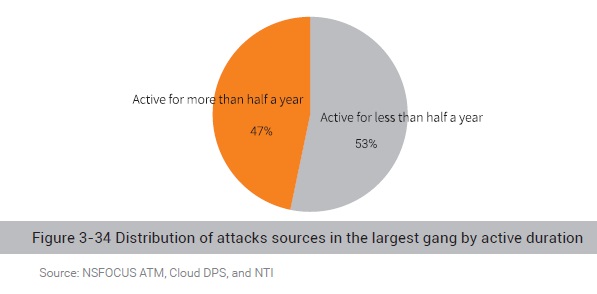
Figure 3-34 shows the distribution of attack sources by active duration, with 47% of attack sources remaining active for more than half a year. Obviously, members in this gang are rather active.
Second Largest Gang by the Number of Attack Sources
The second largest gang in terms of the number of attack sources generates the largest traffic. This gang has 23,000 recidivists and favors volumetric SYN flood attacks. According to historical attack records, 99.54% of recidivists have resorted to this kind of attack. For attacks launched in 2019, the peak attack traffic stands at above 100 Gbps for 60 days, with the maximum hitting 780 Gbps.
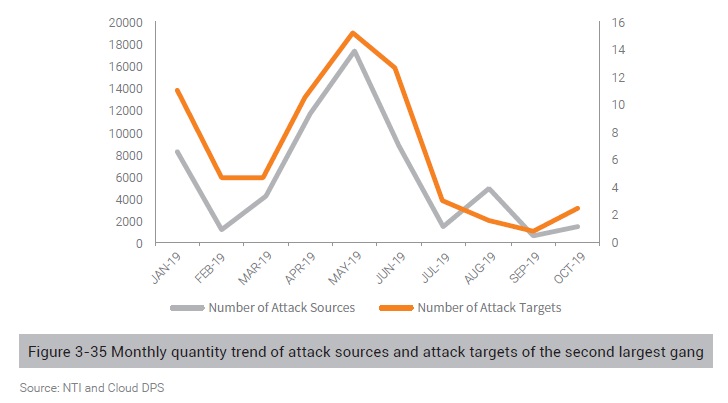
Activity Distribution
Figure 3-35 shows the monthly quantity trend of attack sources and attack targets of this gang. We can see that this gang remains active from January to October, having more attack sources in
January, April, May, and June. On average, 6000 active attack sources launch attacks against seven targets each month.
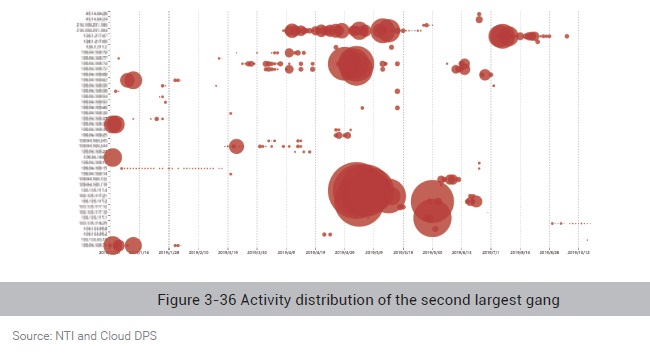
As shown in Figure 3-36, the x-axis indicates the date (by day) and the y-axis indicates IP addresses of attack targets. A red spot indicates that this gang hits an IP address on a specific date. The
size of a red spot represents the number of members involved in attacks against this target. The more intensive and greater the red spots are on a specific date, the more active the gang is, that is,
frequently performing DDoS attacks in a coordinated way. According to statistics, up to 8639 attack sources hit one target at the same time one day, the record high in a single day in 2019.
Attack Type Distribution
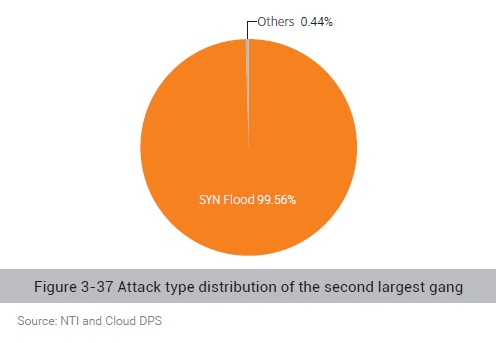
Figure 3-37 shows the attack type distribution of the second largest gang. We can see that this gang mainly resorts to SYN flood attacks.
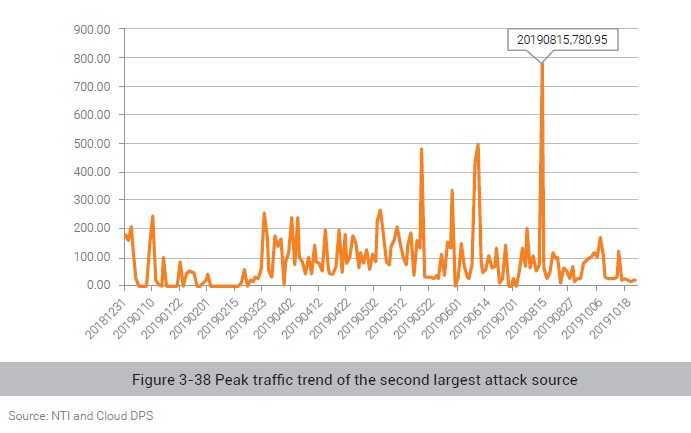
Peak Attack Traffic
Peak traffic (Gbps) is a key indicator to measure a gang’s attack ability and degree of maliciousness. Therefore, knowing the gang’s upper capability limit is of great importance to defense planning. From the gang’s peak traffic trend in 2019 shown in Figure 3-38, we can see that this gang frequently generated over 100 Gbps traffic, with superlarge traffic reaching over 300 Gbps on May 19 and 30 and June 11 and even hitting 780 Gbps on August 15 in 2019. The peak traffic is a reflection of the gang’s control of attack resources and attack ability.
To be continued.