
1. Background
On cyberspace battlefields, adversaries often lurk in the darkness, but will jump at the throat of victims whenever spotting a chance. Today, extensive collection of huge amounts of data from various dimensions is nothing new. This can be very useful for security defenses, but at the same time brings unprecedented challenges to security operations teams. Every day, security operations personnel are up to their necks in massive alerts, busying themselves analyzing alerts, correlating alerts with incidents, and attributing attacks based on their experience and expertise. To address these problems in security operations, it is urgent to find a method to profile attackers from multiple dimensions and assess their potentials before providing assessment results to security operations personnel, who will then identify most dangerous attackers. Attributed graph modeling is an effective method that allows modeling of attackers from aspects of attributes, structures, and temporal features.
Attributed networks are ubiquitous. Examples are social networks, communication networks, and product co-purchase networks, which are characterized by an architecture of nodes, each of which has some attributes used to define its characteristics. In the realm of cybersecurity, attributed graphs are more suitable for modeling of cyberspace data. For example, attacker profiling is the creation of a cyberspace relational graph, where attackers are nodes and their characteristics are attributes. Identifying attackers and their attack paths in large-scale cyberspace relational graphs is an example of applying attributed graph-based anomaly detection in cybersecurity.
Before using an attributed graph for attacker modeling, we should define attributes, vertices, and edges for the graph. In the attributed graph, vertices indicate attackers (or attackers’ IP addresses) and victims (or victims’ IP addresses). If device logs are included, there will also be processes, files, and services represented in the graph. To denote the graph structure, we can use an adjacency matrix, which is a square matrix used to indicate whether vertices are adjacent or not in the graph. As far as attributed graphs are concerned, the adjacency matrix shows attacks conducted by attackers on victims. Vertex attributes represent attacker-related properties, including the IP address, whether the IP address is a public one, segment of the IP address, and ports. Edges indicate attacks launched by attackers on victims. Attributed graph-based anomaly detection is implemented by finding nodes that deviate a lot from other nodes in the behavior pattern. When it comes to network intrusion detection, this detection method can be very useful for identification of real attackers and related behavior.
Today, attributed graph-based anomaly detection has become a much-talked-about topic in the security research community. Some research is focused on identification of anomalous nodes by clustering nodes and analyzing edge weights of different communities. Some studies base anomaly analysis on subspace clustering of node characteristics. More recent studies are around anomaly detection based on residual analysis[i][ii], which uses codec errors to measure how much vertices or edges in a graph deviate from the normal. The following sections describe some typical anomaly detection methods based on attributed graphs.
2. Anomaly Detection Based on Static Attributed Graphs
This section analyzes two anomaly detection methods based on static attributed graphs: One is DOMINANT1, an anomaly detection framework based on undirected graphs, and the other is AnomalyDAE2, an anomaly detection method based on directed graphs.
2.1 DOMINANT
Deep Anomaly Detection on Attributed Networks1 proposes a typical anomaly detection method based on attributed graphs, DOMINANT (Deep Anomaly Detection on Attributed Networks).
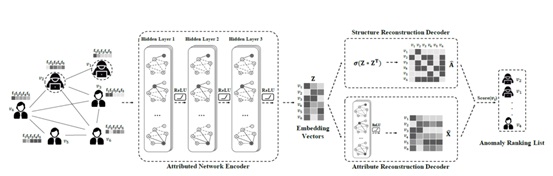
As shown in the preceding figure, the fundamental module of DOMINANT is the deep autoencoder, which consists of three essential components: (1) attributed network encoder, (2) structure reconstruction decoder, and (3) attribute reconstruction decoder. The attributed network encoder models network structure and nodal attributes seamlessly in a joint framework for node embedding representation learning with the graph convolutional network (GCN). The structure reconstruction decoder reconstructs the original network topology with the learned node embeddings. The attribute reconstruction decoder reconstructs the observed nodal attributes with the obtained node embeddings.
Current research shows that the disparity between the original data and the estimated data (that is, reconstruction errors) reflects, to some extent, the abnormality of instances in a dataset. Specifically, data instances with large reconstruction errors are more likely to be considered as anomalies because their patterns deviate significantly from the majority and cannot be accurately reconstructed from the observed data. Of all reconstruction-based anomaly detection methods, the deep autoencoder delivers the best performance. The deep autoencoder is a type of deep neural network, which is used to learn latent representations of data in an unsupervised manner by stacking multiple layers of encoding and decoding functions together. It has made impressive presence in various fields.
The learning process can be described with the following formula. Given an input dataset X, the encoder Enc() is first used to map data into a latent low-dimensional feature space, and then the decoder Dec() tries to recover the original data based on the latent representations.
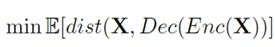
The whole learning process can be seen as learning of code functions indicated in the formula. The deep autoencoder can capture nonlinear information from high-dimensional input by applying multiple layers of linear units and nonlinear activation functions in the encoder and decoder phases. This is typical to deep learning and so naturally better than conventional shallow learning models.
The encoder mentioned in uses GCN, whose concept is built on the premise that the adjacency matrix is symmetric. For this reason, GCN supports only undirected graphs.
2.3 AnomalyDAE
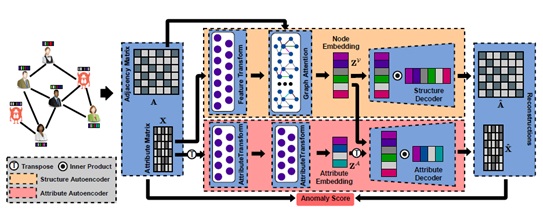
As shown in the preceding figure, AnomalyDAE is an end-to-end joint representation learning framework for anomaly detection. It consists of a structure autoencoder for network structure reconstruction, and an attribute autoencoder for nodal attribute reconstruction. This method takes the learned node embeddings from the structure encoder and the learned attribute embeddings from the attribute encoder as input. Then the structure decoder and attribute decoder jointly capture interactions between the network structure and nodal attributes during model training. Finally, anomalies in the network can be measured by the reconstruction errors of the network structure and nodal attributes.
Interactions between the network structure and nodal attributes are of great importance to graph-based anomaly detection because they reflect anomalies in two different dimensions. For this reason, researchers proposed a joint representation learning framework for anomaly detection through a dual autoencoder (AnomalyDAE), which handles the network structure and nodal attributes at the same time to deliver high-quality graph feature representations. Different from the method proposed in [1], AnomalyDAE consists of a structure autoencoder and an attribute autoencoder to learn the latent representation of nodes and attributes jointly by reconstructing the original network topologies and nodal attributes respectively. Then, anomalies in the network are detected by measuring the reconstruction errors of nodes from both the structure and attribute perspectives. The main contribution of the paper is that a joint representation learning framework is proposed for anomaly detection on attributed networks via a dual autoencoder. It handles cross-modality interactions between the network structure and nodal attributes and detects anomalies from both the structure and attribute perspectives.
3. Anomaly Detection Based on Dynamic Attributed Graphs
In the cyberspace, enterprise threat detection devices collect data in real time, which requires use of dynamic graphs. Temporal data is handled from the time-evolving perspective, posing a new challenge to anomaly detection on attributed networks. For anomaly detection based on dynamic attributed graphs, two methods are available: AddGraph and AMAD.
3.1 AddGraph
The following figure shows the framework of AddGraph. Its core idea is to build a framework to describe normal edges by using all possible features in snapshots (graphs built on data in past times) in the training phase, including structural, content, and temporal features. Then the framework can be further refined and used to measure anomalous edges in subsequent snapshots. Simply put, AddGraph employs GCN to process the previous node state with edges in the current snapshot by considering the structural and content features of nodes. The node states in a short window are then summarized as short-term information with a contextual attention-based model. The output of GCN and short-term information are then fed into the Gated Recurrent Unit (GRU) to get the hidden state of nodes at a new timestamp. The hidden state of nodes at each timestamp is used to calculate the anomalous probabilities of an existing edge and a negative sampled edge, and then fed into a margin loss.
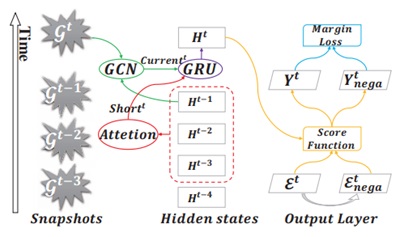
In the preceding figure, we get the hidden state of node Ht at timestamp t. For each edge (i, j, w) ∈ εt, we locate the embedding for the i-th node and the j-th node in Ht, on which we can compute the anomalous score:
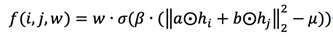
where, hi and hj are the hidden state of the i-th and j-th node respectively, and σ(x) = 1/(1+ex) is the sigmoid function. a and b are parameters to optimize in the output layer. β and µ are the hyper-parameters in the score function.
3.2 AMAD
An Anomaly Detection Framework for Time-Evolving Attributed Networks4 studies methods of detecting anomalies in time-evolving attributed networks. Although anomaly detection for time-evolving attributed networks is widely applicable, it is challenged in two aspects: (1) As the network structure and nodal attributes evolve with the time, and anomalous nodes change accordingly, models need to be updated online from time to time to ensure the detection effect; (2) Minor disturbances to the network structure and nodal attributes may cause a ripple effect to the derivative mode of attributed networks, so a mechanism representing the evolution of the underlying network becomes a key to accurate detection of anomalous nodes.
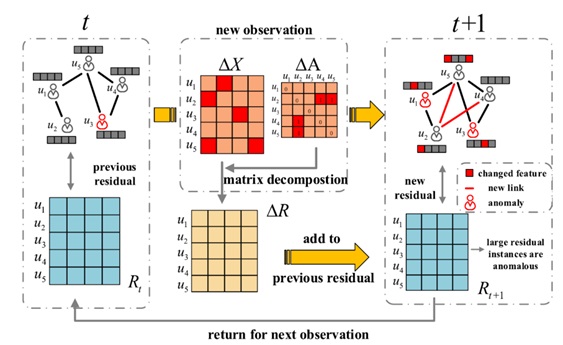
To tackle these problems, the paper proposes a dynamic anomaly detection framework for time-evolving attributed networks on the basis of residual analysis, namely AMAD. Under the assumption of temporal smoothness, AMAD leverages the small smooth disturbance between two consecutive timestamps to characterize the evolution of networks for incremental updates, thus ensuring the effect of anomaly detection. The selection of features ensures the robustness of algorithms to detect noisy data. The work flow of AMAD is shown in the preceding figure, which, in nature, is a characterization of the subsequent graph with the current one by using incremental representations. The anomaly in this figure refers to the difference between vectors of the two graphs that are temporally adjacent.
4. Anomaly Detection Based on Heterogeneous Attributed Graphs
A heterogeneous graph, in contrary to an isomorphic graph, has vertices and edges of different types. In the cyberspace, after network-side and device-side alert logs are correlated, vertices in an attributed graph can represent different types of nodes, including IP addresses, processes, services, and files. When it comes to heterogeneous attributed graphs, different types of vertices and attributes have different properties. Therefore, anomaly detection based on such graphs is a hard nut to crack for attributed graph researchers.
Multi-scale Anomaly Detection on Attributed Networks[v] proposes a method of assessing how anomalous heterogeneous graph nodes are by assessing the concentration of each node upon smoothing of specific signals on the vertices of the graph. Besides, the paper introduces a graph signal processing formulation of the Markov stability framework used in community detection, in order to find the context of anomalies. Finally, the authors illustrate the scalability of their approach in large networks employing Chebychev polynomial approximations.
Because how anomalies are generated in real-world networks is usually unknown, accurately defining anomalies is a very difficult task and measuring the degree to which a node is anomalous is also challenging.
By using a multiscalar community detection algorithm to compute edge weights, we can cluster nodes that are similar in attributes to discover all the relevant contexts for anomalous nodes. In this sense, a node can be an outlier only at certain scales and not necessarily at all scales. Using the multi-scale anomaly detection method can discover real anomalous nodes from the global perspective.
In short, the paper proposes a principled mechanism to rank nodes on an attributed network in terms of their abnormality and localize outlier nodes within their context at all scales in the network. The authors also show that their method is parallelizable and scalable thanks to the Chebychev approximations of the exponential of the graph Laplacian. Besides, this provides a faster methodology for the continuous-time Markov stability framework for community detection.
5. Conclusion
Graph modeling is inherently superior to other methods in terms of characterization of network alert logs. The complexity of the cyberspace, however, still makes graph modeling a challenging task. It is feasible to use attributed graphs to assess threats and identify attack behavior. This article, considering current attack and defense scenarios in the cyberspace, illustrates the advantages of attributed graph modeling. Discovery of suspected attackers and attack behavior by using anomaly detection based on attributed graphs is an effective method, which can detect both known and unknown attacks. But the assumption of this method is that attack behavior is anomalous, so being good in coverage, it may be deficient in the detection accuracy.
[i] Ding K, Li J, Bhanushali R, et al. Deep Anomaly Detection on Attributed Networks [M]// Proceedings of the 2019 SIAM International Conference on Data Mining. ACM, 2019.
[ii] Fan H, Zhang F, Li Z. AnomalyDAE: Dual autoencoder for anomaly detection on attributed networks [J]. 2020.
[iii] Zheng L, Li Z, Li J, et al. Addgraph: anomaly detection in dynamic graph using attention-based temporal GCN[C]//Proceedings of the 28th International Joint Conference on Artificial Intelligence. AAAI Press, 2019: 4419-4425.
[iv] Xue L, Chen Y, Luo M, et al. An Anomaly Detection Framework for Time-Evolving Attributed Networks [J]. Neurocomputing, 2020, 407.
[v] Gutiérrez-Gómez, Leonardo, Bovet A, Delvenne J C. Multi-scale Anomaly Detection on Attributed Networks [J]. 2019.