
01 Overview of the Vulnerability Trend
In 2020 H1, a total of 1419 vulnerabilities were added to the NSFOCUS Vulnerability Database (NSVD), 714 of which were high-risk vulnerabilities. Among these high-risk vulnerabilities, 184 vulnerabilities were Microsoft-related ones. High-risk vulnerabilities were mainly distributed in major products of Microsoft, Oracle, Adobe, Google, Cisco, IBM, Moxa, Apache, etc.
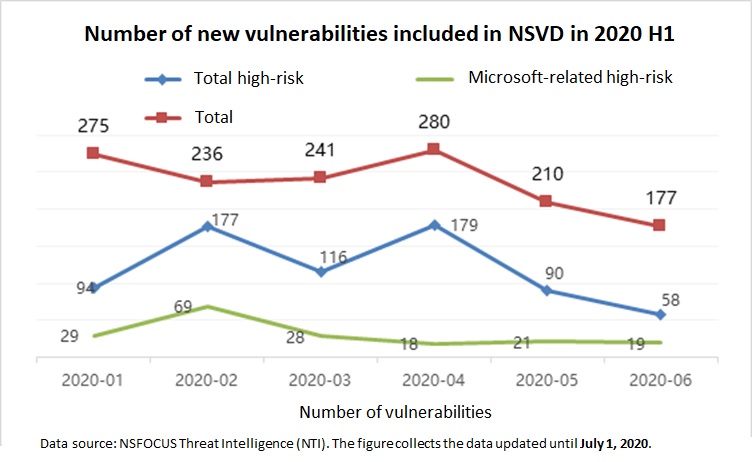
Note: The NSFOCUS Vulnerability Database (NSVD) contains application vulnerabilities, security product vulnerabilities, operating system vulnerabilities, database vulnerabilities, and network device vulnerabilities.
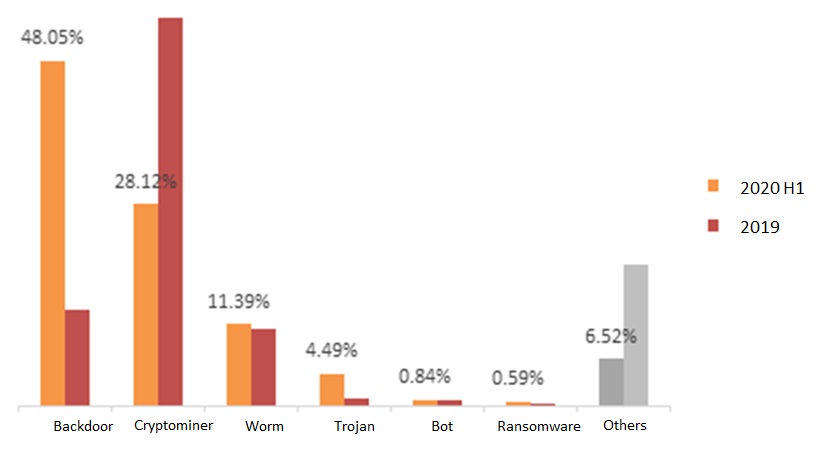
02 Overview of the Malware Trend
From data collected throughout 2019 and 2020 H1, we extracted information about malware’s distribution by type, shown in the following figure. Compared with 2019, the percentages of various types of malware in 2020 H1 changed, with backdoors overtaking crytominers to become No .1 with a percentage of 48.05%, and the percentage of cryptominers fell significantly. Meanwhile, worms’ activity maintained at the same level as 2019. Cryptominers, worms, and backdoors together accounted for 87% of all malware activities.
03 Overview of the IoT Security Trend
2020 H1 witnessed nine Internet of Things (IoT) security events that deserved close attention:
- Ripple20 0-day vulnerabilities were discovered and affected hundreds of millions of networked devices in various industries across the globe.
- A high-risk 0-day vulnerability was detected in dozens of Netgear router products.
- A group of Industrial Control System (ICS) honeypots attracted four 0-day attacks.
- A critical remote code execution (RCE) vulnerability affected millions of network devices based on OpenWrt.
- Hackers exploited 0-day vulnerabilities in DrayTek devices to launch attacks on enterprise networks.
- Hackers hijacked a smart building access system and could launch distributed denial-of-service (DDoS) attacks on devices accessible via networks.
- Millions of devices using LoRaWAN were vulnerable to hacker attacks, and nodes, gateways, and servers in the LoRaWAN network were prone to critical vulnerabilities. Therefore, their security protection capabilities remained to be improved.
- Hackers divulged Telnet credentials of over 500,000 devices.
- Researchers discovered LiquorBot, which was a new botnet with the cryptomining function.
In 2020 H1, Exploit-DB recorded a total of 84 new IoT-related exploits, which mainly involved vulnerabilities in network device vendors represented by Netgear. In our opinion, the reason was that top network device vendors usually sold large number of devices and researchers paid more attention to their devices. Exploits were dominated by RCE and denial-of-service (DoS), mostly RCE vulnerabilities, accounting for more than 35% of the total.
In 2020 H1, NSFOCUS’s threat hunting system captured 26,998,718 access request logs from 266,632 IP addresses. 12.98% of the access requests were malicious attacks that exploited IoT vulnerabilities. Most vulnerabilities exploited by attackers had exploit scripts available in Exploit-DB. The most exploited vulnerabilities included the D-Link device vulnerability (CVE-2015-2051) and the MVPower DVR vulnerability (EDB No.: 41471). Analysis of source IP addresses found that 159,679 IP addresses, which accounted for 59.89% of the total, performed exploits and other malicious actions. IP addresses associated with malicious actions were distributed in 201 countries and regions. China had the most malicious IP addresses, accounting for 23.6% of all malicious IP addresses.
04 Overview of the DDoS Attack Trend
In 2020 H1, we detected 210,000 DDoS attacks, with 110,000 TB of traffic in total. 67% of these attacks lasted less than 5 minutes. In terms of the temporal distribution in a day, attacks can occur at any hours of the day. In terms of the temporal distribution in a week, attacks can occur on any day of the week, with Wednesday seeing the most. Major attacks in the first half of 2020 were SYN flood, accounting for 43.17% of the total number of attacks. In terms of traffic, UDP floods took the first place, generating 75.5% of attack traffic. In 2020 H1, we monitored 15 IP gangs, of which IPGang01 was the largest one. IPGang01 contains 217,000 attack sources and 130,000 monthly active resources. Active days in the first half of 2020 amounted to 164 days. During this period, 58,000 attacks were launched against 1366 targets, generating 13,000 TB of traffic in total.
05 Overview of Botnet and Honeypot-captured Threat Trends
In the distributed denial-of-service (DDoS) botnet activities in 2020 H1, most were from Mirai, Gafgyt, and other major families.
In 2020 H1, DDoS attack means were dominated by UDP floods, CC, and TCP floods.
In 2020 H1, Hostwinds, Digital Ocean, and OVH were the major hosted cloud service providers of C&C servers. We predict that it will remain unchanged in 2020 H2.
In the same period, 128 types of vulnerabilities were detected to be spread and exploited by the Internet of Things (IoT) trojans. Of all these vulnerabilities, CVE-2017-17215 (in Huawei HG532 routers), CVE-2014-8361 (Realtek rtl81xx SDK remote code execution vulnerability), and ThinkPHP remote code execution vulnerability were the most frequently exploited.
Through NSFOCUS’s threat hunting system, we have kept an eye on a botnet specializing in Monero cryptomining for a long time. The botnet intrudes upon hosts by cracking weak passwords and gains control permission by implanting bot programs. Meanwhile, it downloads and executes Monero cryptomining scripts via the downloader for malicious cryptomining. The cryptomining botnet became increasingly active in 2020 H1, involving a total of 20,830 active bots. China was the country with the most bots, which were as many as 8304, accounting for 40% of the total. Port 22 was opened on 13,664 bots, approximately 66% of all bots. According to known asset intelligence, device types were ,ainly routers and cameras.