When a customer business system experiences a security incident, they often need to conduct forensic analysis on historical network traffic to identify the source of the intrusion and reconstruct the entire incident for targeted emergency response. In scenarios where customers have such traffic-analysis requirements, we can leverage the traffic forensics capabilities of the ISOP platform to reconstruct historical attack behaviors or traffic associated with specific sessions in the customer’s environment. The reconstructed pcap files can then be downloaded and provided to the customer for further detailed analysis.
The core of ISOP’s traffic forensics capability relies on UTS’s traffic storage and restoration capabilities. The ISOP platform achieves traffic restoration and forensic analysis in customer networks by calling UTS’s API interfaces.
Configuration steps
1. UTS configuration storage Path: [Policy Configuration—Traffic Management—Enable Full Traffic Storage]
2. UTS System Configuration
In the UTS [System Configuration—Professional Parameters]
- Log sending parameters: Change the threat log sending setting to [Yes].
- Traffic storage parameters: Change the number of TCP sessions to [50].
3. Add traffic forensics equipment to ISOP.
At UTS [System—Account Management—API Account Configuration], create a new API account.
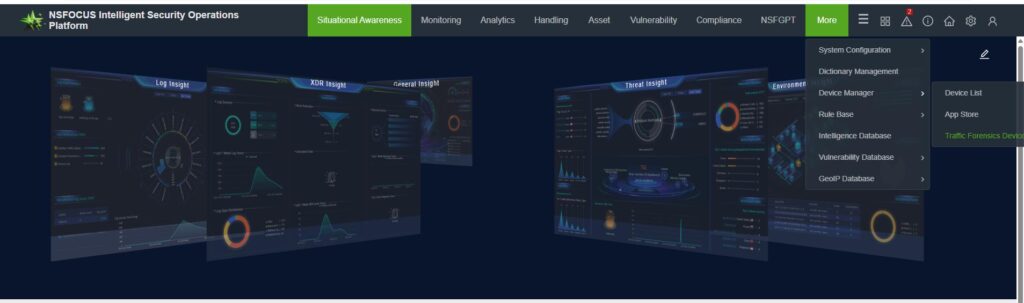
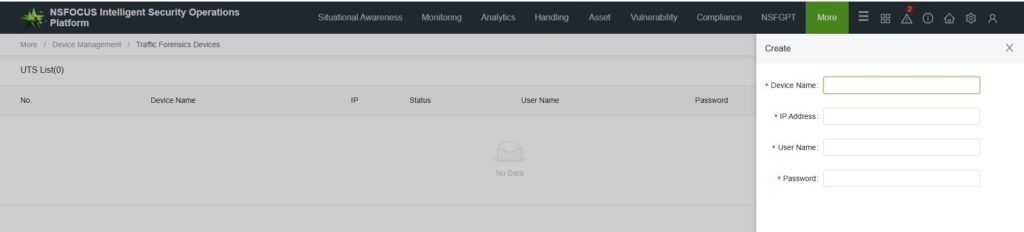
At ISOP [More—Device Management—Traffic Forensics Device], in the configuration, add a traffic forensics device.
4. Traffic Forensics and Download
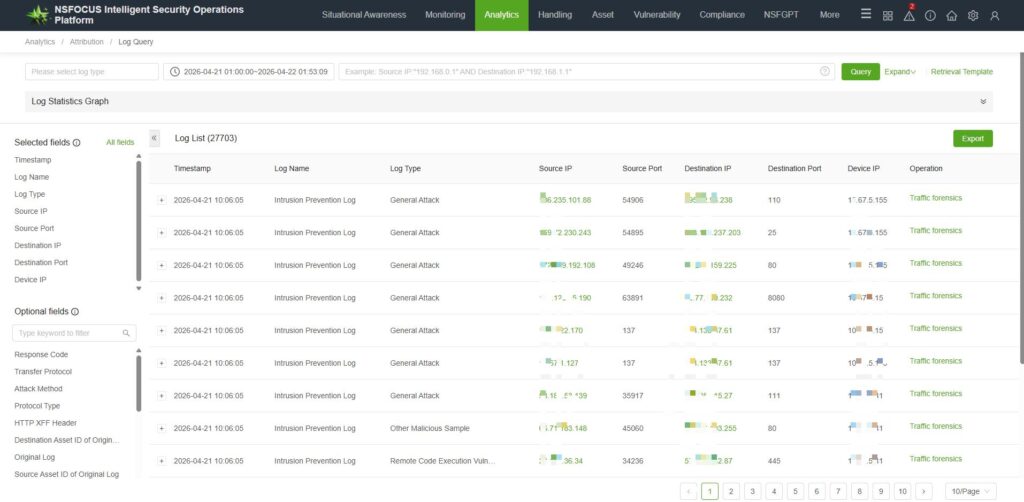
Traffic forensics can be initiated based on session data or malicious traffic logs on the platform.Go to [Analytics—Attribution—Log Query]. For intelligent log retrieval, click [Traffic Forensics].
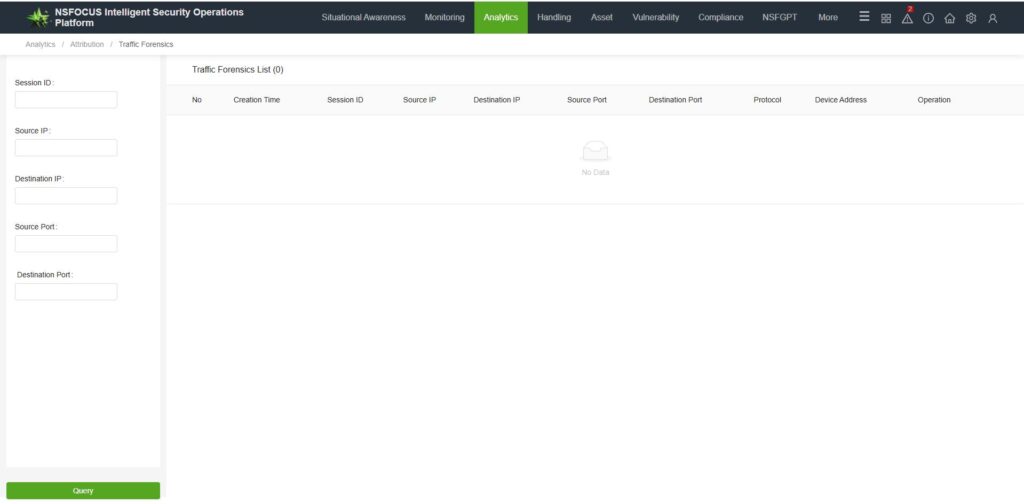
Historical evidence-gathering tasks can be downloaded in [Analytics—Attribution—Traffic forensics].
Frequently Asked Questions
1. Is there no traffic forensics button in the log?
ISOP’s traffic forensics targets UTS logs and requires that the logs must include session IDs in order to perform traffic forensics. In other words, the following two conditions must be met:
- The log source is the UTS probe.
- The session ID in the log is not empty.
2. Click the traffic forensics button and receive the prompt: “No pcap forensics device configuration information”?
Identify potential causes:
- Check whether the evidence collection device has been configured according to the configuration requirements.
- Verify that the IP address of the “Device Address” in the logs matches the actual management IP address of UTS. The Device Address field in the platform logs is populated with the “Local IP Address” from the UTS Device Security Center. If it does not match the M-port IP address, please modify the UTS Local IP address and re-collect evidence after the new logs are integrated.