
In today’s business security operations, the tide of security information and event management (SIEM) is on the ebb. Many enterprises have established the security operations center (SOC) and collected massive security data. But how to make use of and analyze such data remains a problem to be resolved. Data, after being collected, is usually stored, without being further processed, which renders the data valueless. In fact, what really matters in the cybersecurity realm is still data. As an attacker, you need to obtain asset data and vulnerability data before successfully launching an attack. As a defender, you need to obtain asset data and device alarm data before detecting and blocking attacks. To accurately analyze attacks, you must have such data as the Domain Name System (DNS), samples, and user behaviors in hand. How to Analyze Security Alarms, which will come in series, is intended to provide an in-depth analysis of security alarm data on the enterprise network side, tap the potential values of data, and help enterprises implement day-to-day security operations.
In the past several years, some companies have resorted to data analytics and artificial intelligence (AI) to analyze security alarms. Analyzing and understanding data and subsequently labeling data are prerequisites for use of advanced algorithms such as AI algorithms. Unfortunately, this process is usually skipped in practice. This article, as the first of the series, deals primarily with the methodology of security alarm data analysis and uses a cyberattack exercise as an example to describe how to label alarm data, and analyze and sum up the possible directions for research and the potential values of data.
1. Introduction
The architecture of modern enterprise networks is becoming increasingly complex, as demonstrated in complex network segmentation, cloud-delivered business, and new types of network devices. As a result, security devices are generating more and more alarms with each passing day. SOC teams usually find ways to store alarm data. But, they are encumbered by a lack of appropriate analysis methods and so often groan under the load of such massive data that keeps accumulating at an alarming rate. Experience tells us that, generally, a large or medium-sized enterprise engaging in somewhat complicated business can have over 1 million alarms generated a day. In the industry, the basic components of such data are rarely known, making it hard to get a general idea of the data. Besides, the corresponding processing methods, such as User Entity and Behavior Analytics (UEBA), are a bit too abstract. By far, we have not heard of any methods capable of complete analysis of alarm data. On the other hand, in academia, the research on data generated by the intrusion detection system (IDS) began at the onset of the 21st century, when the network architecture was relatively simple and attack methods were limited. The past few years have witnessed some research outcomes, which, however, are based on datasets of 20 years ago and so do not make much sense. Now, what should we do about security alarm analysis? What values are contained in security alarm data? Please read on to find the answers.
2. Cans and Cannots of Security Alarm Analysis
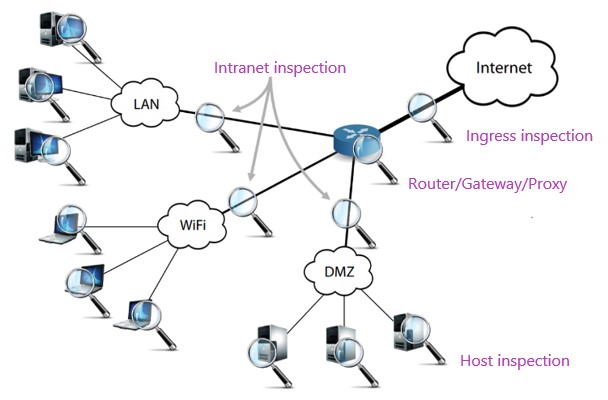
As shown in Figure 1, enterprises typically deploy security devices on the egress of the intranet and enterprise network to analyze network traffic for threats. Mainstream security devices usually perform rule-based detection. Moreover, they can hardly do anything meaningful in the face of encrypted traffic, except generating related logs, for example, about a Secure Sockets Layer (SSL) negotiation event. Generally, the analysis of network-side security alarms cannot yield satisfactory results for the following types of traffic:
- Traffic not passing through security devices. In practice, this is a common scenario. Enterprises tend to deploy security devices only before critical assets or large zones. In addition, attackers have various methods to have their traffic bypass security devices.
- Attack behaviors not covered by rules. In large-scale cyberattack exercises, attackers usually attack targets by exploiting 0-day vulnerabilities in their hoards. Such attacks generally do not trigger any alarms on the network side and can be possibly identified only through host-based detection.
- Encrypted traffic. Security devices employing deep packet inspection cannot decrypt encrypted traffic and can only handle such traffic after finding ways (for example, obtaining the certificate of the target website) to decrypt it.
When analyzing massive security alarm data, mature security operations personnel tend to adopt either of the following methods:
- Analyze only alarms regarding critical assets. This is because the number of alarms is usually limited for a specific target.
- Analyze only alarms of specific types. Experienced operations personnel know which security products generate alarms of high confidence level and they pay attention only to credible, high-risk alarms.
This method roughly ranks alarms and picks out high-risk ones for analysis. This, obviously, is not enough. Sometimes, it is necessary to perform a joint analysis of alarms of varying risk levels. Besides, even if security operations personnel are concerned about alarms of only specific types, they cannot completely ignore others, which may contain a lot of useful information about attacks.
You may now wonder what can be derived from security alarm analysis. As we all know, security devices can “see” not only attack traffic but also normal traffic, which contributes to the high rate of false positives. Normal traffic detected is not useless, but can be used to inventory assets and reveal the intranet environment. To be specific, security alarm analysis is expected to achieve the following purposes:
- Asset inventorying. Large enterprises usually find it hard to manage their great number of assets, which are often left in disarray. Manually straightening out these assets is no easy job and so becomes a pain point in routine security operations. In fact, we can extract IP addresses from alarm data and base asset inventorying on such data. Different types of assets tend to be related to alarms of different severity levels, which can somewhat inform the classification of assets.
- Gray behavior identification. Take vulnerability scanning as an example. Routine vulnerability scanning is taken as normal, but unplanned scanning is taken as anomalous and needs to be tracked, which may provide useful information for attack detection.
- Attack identification. Identifying attacks is what a security device is supposed to do.
3.  Analysis of Security Alarm Data
This section uses a cyberattack exercise as an example to briefly analyze the components of alarm data, possible solutions, and values of such data.
- Basic Components of Alarm Data
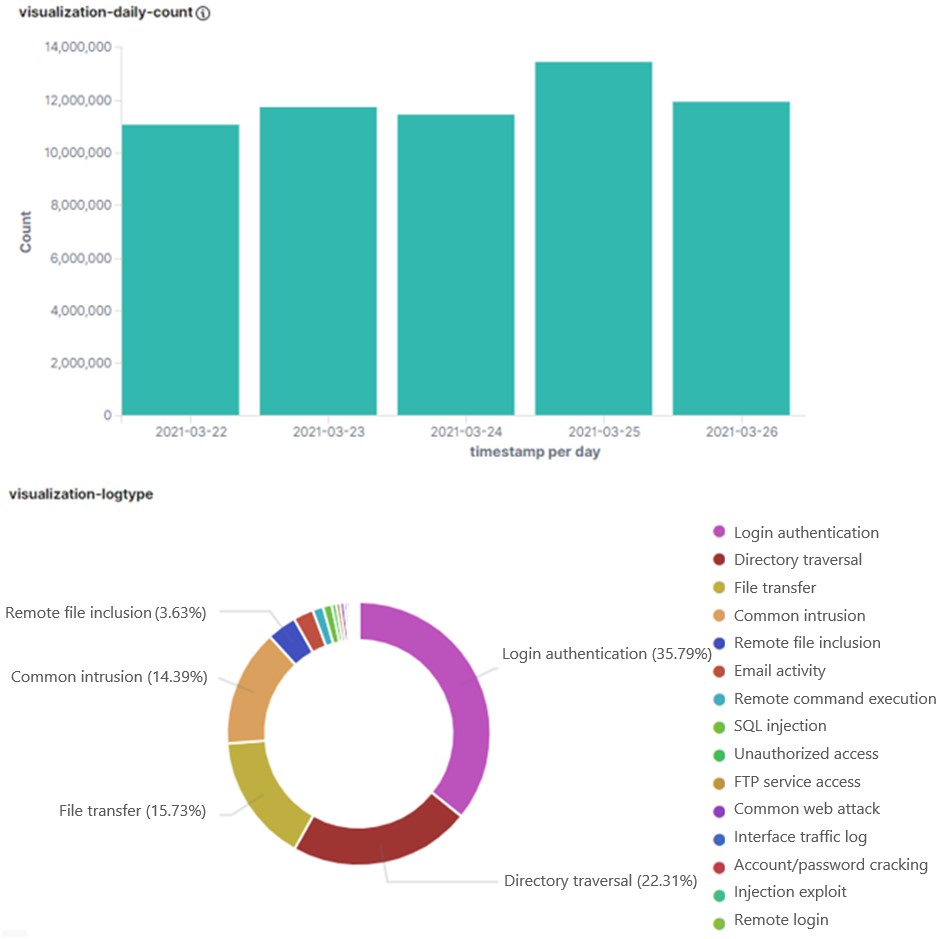
For the purpose of this article, we collect network-side data of security alarms generated in a five-day cyberattack exercise. Figure 2 shows related statistics. It can be seen that over 10 million alarms are generated each day, that is, over 50 million alarms in the five days. Of all these alarms, authentication, directory traversal, and file transfer alarms are top 3 types, together making up over 70%. Except a small portion of authentic attacks, the majority of alarms are innocuous. Let’s look more closely at this “odd” data.
- Data Analysis Procedure
1) Extract useful fields.
As original packets contain a lot of useless information, we do some filtering and finally get nine useful fields:
- timestamp: time when the alarm is generated
- sip: source IP address
- dip: destination IP address
- device_ip: IP address of the probe generating the alarm
- dport: destination port
- log_message: alarm type
- payload: payload of the alarm (data above the IP layer)
- q_body: request body of web access
- r_body: response body of the web access request
If an alarm is triggered by web access, the q_body field is available; otherwise, there is only the payload field. Besides, some fields may be missing for reasons on the part of devices.
Note that almost all academic papers on IDS alarm analysis exclude the payload field, which is actually an important basis for determining whether an attack happens during day-to-day operations and so cannot be ignored. For this reason, the payload and q_body fields are included in our analysis. As r_body is also important for attack identification, this field should be analyzed. Moreover, as the distribution of attack alarms varies with where the probes are deployed (extranet, intranet, …), the device_ip field is analyzed to reveal the location of security devices.
2) Deduplicate data.
As is known to us, a packet usually passes through multiple detection devices on its route from outside of an enterprise to the intranet. This will definitely generate repeated alarms, which should be deleted. Ideally, only one alarm is generated about an attack on a target from an attacker at a specific moment of time. For this purpose, original alarms should be deduplicated based on the timestamp, sip, dip, dport, and payload fields. Like any other things, this also has exceptions. For example, sometimes the timestamps are inconsistent because of too long packet delay, or different payloads, after being truncated by devices, contain the same content. However, these issues are less frequently seen and so can be ignored.
3) Analyze data.
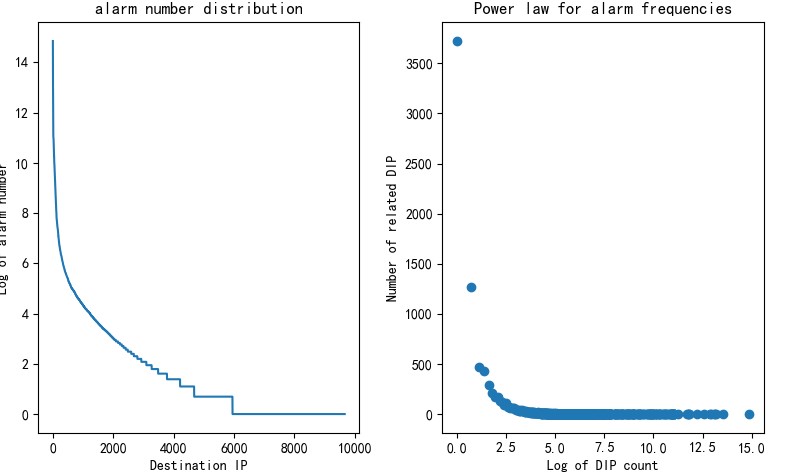
Generally, the log_message field can quite accurately reveal the attack type except for a few alarm types whose such field can be very misleading. The left part of Figure 3 shows the distribution of alarm types. The x-axis represents alarm types and the y-axis represents the number of times a type of alarms occurs. Clearly, the alarm types have a long tail distribution. The right part of Figure 3 shows the power law for alarm frequencies. The x-axis represents the log of alarm type count and the y-axis represents the number of related alarm types. For example, the point (0, 58) in the red frame indicates that 58 alarm types have only one log message. This analysis of data distribution informs subsequent selection of an advanced algorithmic model.
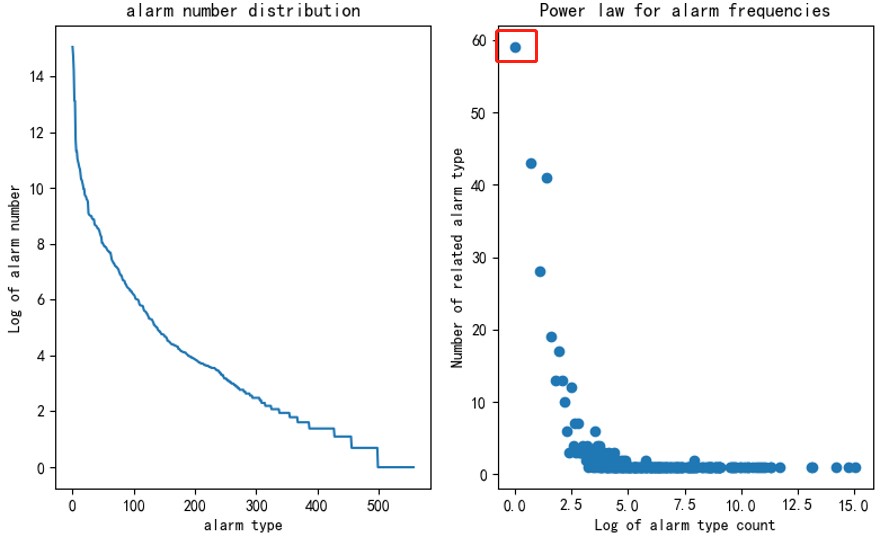
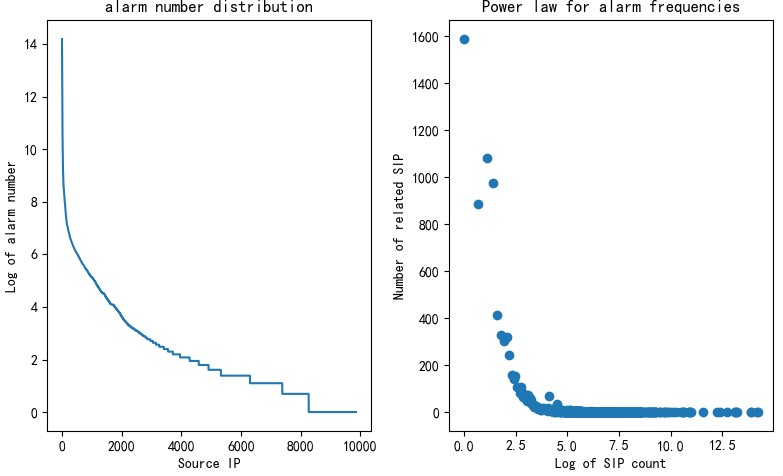
The preceding figure clearly shows that alarm types (log_message) have an obvious long tail distribution. In fact, this is not unique to alarm types. For other attributes like the source IP address and destination IP address, alarm distributions show the same trend, as shown in Figure 4 (source IP addresses) and Figure 5 (destination IP addresses), where the x-axis and y-axis have similar meanings to Figure 3. Regardless of the statistical dimension, alarms are in long tail distribution, which is not only useful for selection of an advanced algorithmic model (such as word2vec algorithms) but also tells us that there is a certain pattern in alarm distribution. Such a pattern is closely related to the similarity of traffic. This article does not delve into the cause of this phenomenon. What we need to do is consider this feature in subsequent alarm analysis: As there is only a small proportion of attack traffic or anomalous traffic and the preceding pattern of alarms will remain so in a long time, the first thing to do will be filter out these alarms, with the others taken as important ones requiring analysis.
4) Classify data.
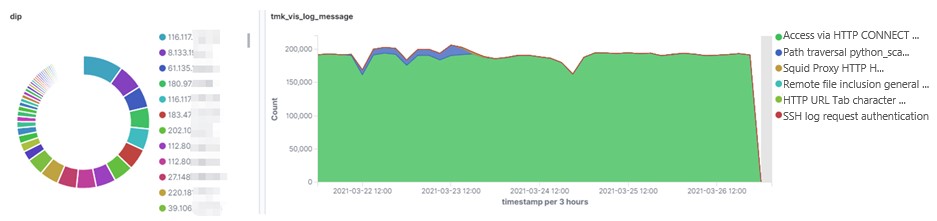
Overall, alarms are filtered and classified by the count and criticality. Specifically, normal alarms that are in large quantities and at lower levels of criticality are first filtered out. The source IP address 10.5.237.232 is used as an example here. It is linked with the largest number of alarms. As shown in the left part of Figure 6, alarms triggered by this source IP address show traffic destined for different IP addresses. As shown in the right part of Figure 6, proxy connection appears in the largest proportion of alarms, which have a fixed pattern. This type of alarms is usually considered less important in alarm analysis, so all the alarms classified as “access via HTTP CONNECT tunneling (HTTP proxy)” are taken as normal (triggered by normal business) and filtered out. This cuts out over 6 million alarms, that is, about 13% of the total.
Note that we should classify alarms by a fine granularity, that is, sorting alarm data by taking various aspects into account. Assume that IP address A frequently triggers various types of alarms. We cannot simply ignore alarms triggered by A, but should find out what these alarms are about, what types of alarms are common, and what types are uncommon. To be more specific, the number of alarms triggered by 10.66.240.216 is quite stable (see the upper part of Figure 7), seemingly indicating no exception. However, when we move to the lower part of the figure, we can see that this source IP address initiates massive scanning traffic to 10.245.38.183. This type of scanning is unplanned and irregular, posing a potential threat to the intranet. However, as this part of alarms is hidden in the sea of alarms triggered by this source IP address, they are very difficult to detect in the upper part of the figure.

To conclude, we should isolate normal alarms that are large in quantities and low in criticality. In the process of analysis, we should aggregate and count alarms by a fine granularity, that is, sorting alarm data by taking various aspects (such as source IP addresses and destination IP addresses) into account.
5) Derive analysis results.
By combining automatic with manual methods, we can derive analysis results of most alarms and label them. Generally, alarms can be classified into four types:
- Normal alarms. These alarms are on normal behaviors, usually representing normal business, including planned vulnerability scanning.
- Low-risk alarms. The Internet is laden with worms and zombies, which are frequently used to launch attacks. As such attacks are often unsuccessful, related alarms are taken as low-risk ones and the source IP addresses are blocked.
- Gray behavior. These alarms are on events of a certain level of risk, which require handling. For example, when alarms are reported on unplanned intranet scanning or worm spreading across the intranet, it is necessary to contact the asset owner for further investigation.
- High-risk alarms. These alarms revolve around intrusions that are happening or have happened.
These four types of alarms decrease degressively in number, but increase progressively in criticality.
4. Conclusion
This article provides a high-level understanding of the values brought by security alarm analysis. With a real-life cyberattack exercise as an example, it explores the general trend of classification and analysis of such data based on statistical analysis and roughly classifies security alarms. As the first of the How To … series, this article discusses only the general trend of security alarm analysis. The next article will be about the specific algorithms used for data labeling, so stay tuned!